How To Connect Swagger and NET Core Instruction

How To Connect Swagger and NET Core Instruction

How to implement Swagger in ASP.NET Core 6

Swagger ASP NET Core

Let’s start with what is Swagger?

Swagger is an open source set of RESTful API development and documentation rules, specifications, and tools. Developers can use the Swagger framework to create interactive, machine- and human-readable API documentation.

API specifications typically include information such as supported operations, parameters and outputs, authorization requirements, endpoint availability, and license requirements. Swagger can automatically generate this information from the source code by asking the API to return a documentation file based on its annotations.

Swagger assists users in creating, documenting, testing, and consuming RESTful web services. It is compatible with both top-down and bottom-up API development approaches. Swagger can be used to design an API before any code is written in the top-down, or design-first, method. Swagger generates documentation from code written for an API in the bottom-up, or code-first, method.

Swagger component:

Swagger offers a number of open source API tools, including:

  • Swagger Editor- This tool allows developers to create, design, and describe new APIs as well as edit existing ones. The web-based editor renders OpenAPI specifications visually, handles errors, and provides real-time feedback.
  • Swagger Codegen enables developers to generate client library code and SDKs for various platforms.
  • Swagger User Interface- This is a completely customizable tool that assists engineers in creating documentation for a variety of platforms. It can run in any environment.
  • Swagger Inspector is an API documentation testing tool. APIs can be validated without restriction, and the results are automatically saved and accessible in the cloud.

What are the benefits of using Swager

Swagger provides several additional benefits in addition to its goal of standardizing and simplifying API practices.

  • It has a user-friendly interface that serves as a blueprint for APIs.
  • Both developers and non-developers, such as clients or project managers, can understand the documentation.
  • Human and machine readable specifications
  • Produces interactive, testable documentation.
  • Over 40 languages are supported for the creation of API libraries.
  • JSON and YAML formats are acceptable for easier editing.
  • Facilitates the automation of API-related processes.

How to add Swagger on .Net Core 6

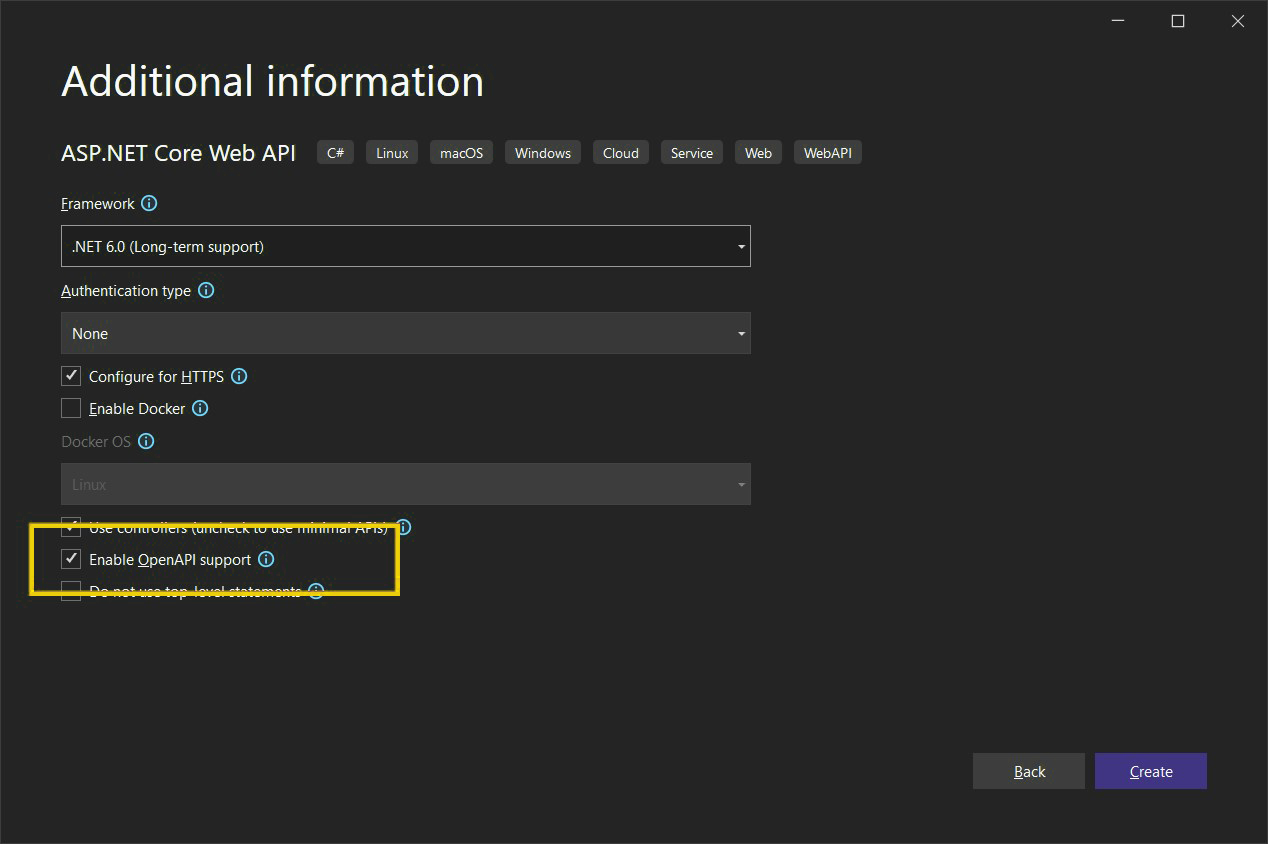
When starting an ASP.NET Core 6 project in Visual Studio 2022, you can integrate Swagger to an ASP.NET Core 6 application. The “Enable OpenAPI support” check box in the Visual Studio 2022 project creation wizard is selected by default. This option guarantees the installation of all swagger-related nuget packages and the presence of the Program’s necessary swagger-enabling Program.cs.

Program.cs, why? Because Startup.cs and Program.cs files are now integrated for an uniform experience with ASP.NET Core 6.0.

As you will see on the below image  the Enable OpenAPI support checkbox is checked.
Swagger connection

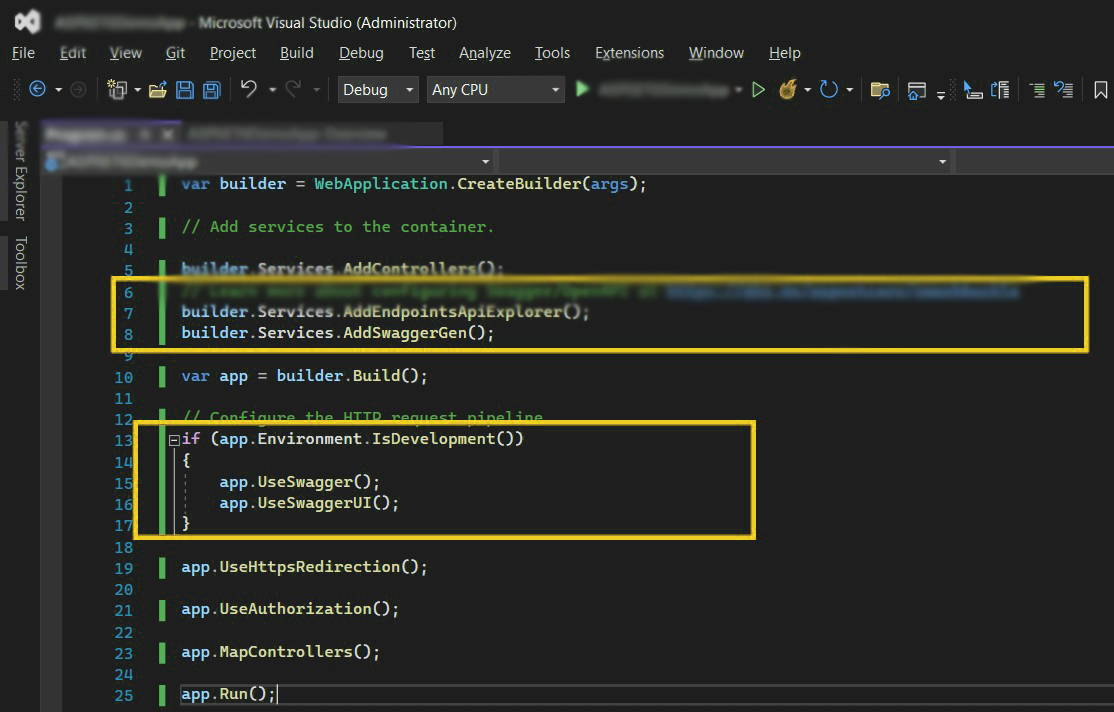
You can observe that Swagger-related code is already there in Program.cs. The middleware for the development environment is added, and the Swagger service is registered. You can see that the Swashbuckle nuget package has automatically installed for you in Solution Explorer.
Swagger NET Core

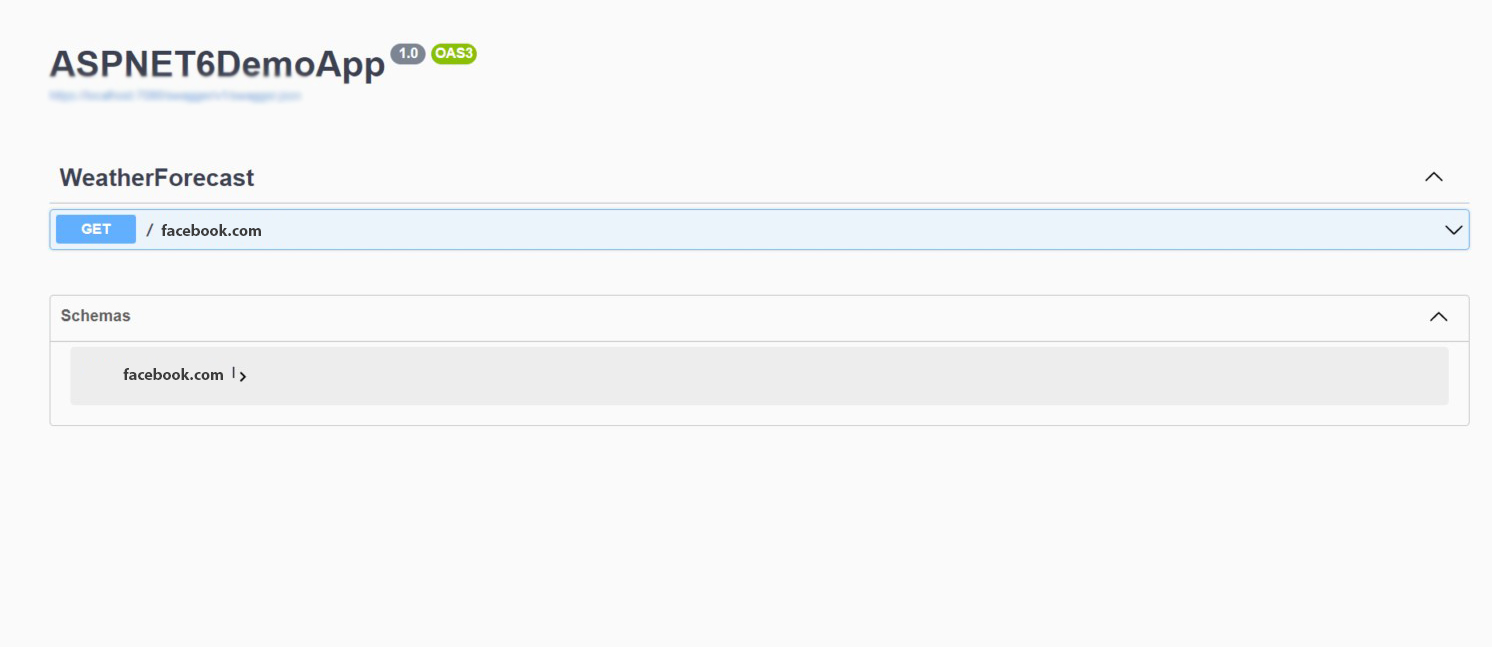
Without adding anything extra, if you try and execute the application it will open the Swagger UI for the Weather Forecast API.

And is the weather forecast controller will be created and it will contain the following code:
using Microsoft.AspNetCore.Mvc;

namespace SwaggerDemo.Controllers

{

    [ApiController]

    [Route(“[controller]”)]

    public class WeatherForecastController : ControllerBase

    {

        private static readonly string[] Summaries = new[]

        {

        “Freezing”, “Bracing”, “Chilly”, “Cool”, “Mild”, “Warm”, “Balmy”, “Hot”, “Sweltering”, “Scorching”

    };

        private readonly ILogger _logger;

        public WeatherForecastController(ILogger logger)

        {

            _logger = logger;

        }

        [HttpGet(Name = “GetWeatherForecast”)]

        public IEnumerable Get()

        {

            return Enumerable.Range(1, 5).Select(index => new WeatherForecast

            {

                Date = DateTime.Now.AddDays(index),

                TemperatureC = Random.Shared.Next(-20, 55),

                Summary = Summaries[Random.Shared.Next(Summaries.Length)]

            })

            .ToArray();

        }

    }

}
ASP NET CORE

But why is it that it is automatically redirecting to Swagger UI? Well, it is automatically redirecting there because of “launchUrl”: “swagger” is already set in the launchsettings.json file.

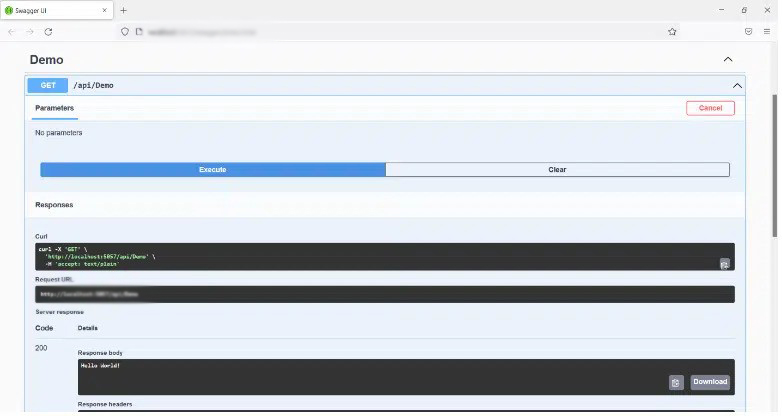
When you  execute the HttpGet method in Swagger, here is how the output will appear:
Swagger NET

Conclusion

I can say with great confidence that Swagger is a fantastic tool for API documentation. It also offers an interface for using the action method executions. Swagger can be modified to meet your needs. For instance, you may adjust how Swagger tests your API and add more information to the documentation for your API.

Data Visualization Like a Special Way to be Successful. How Can You See More

Data Visualization Like a Special Way to be Successful. How Can You See More

Data Vizualization

Data Visualization as a vital monitor

Data is used by both organizations and people to uncover problems’ root causes and provide appropriate solutions. Making sense of the ever-increasing volume of data, however, becomes more and more difficult. We have an intrinsic desire to look for patterns and organization. We acquire new knowledge and store it in this way. Finding structure and recognizing these patterns can be challenging or even impossible when incoming data is not visually appealing.

We’ll examine how data visualization can be used to address the aforementioned issue in this article. In addition, we’ll discuss what data visualization is, why it’s crucial, how to improve your data visualization abilities, typical graphs, and tools you can use to simplify the process of displaying your data.

What is Data Visualization?

Data visualization is the graphic representation of data. Putting data into a visual context is what it is all about, and charts, plots, animations, infographics, etc. may all be used to do this. Its purpose is to facilitate human identification of trends, outliers, and patterns in data. Data professionals frequently use data visualizations to condense important findings from data and communicate those findings to the right stakeholders. For management staff, a data professional might, as an example, generate data visualizations that they can use to project the organizational structure. Another illustration is how data scientists can gain a better grasp of their data by using visualizations to reveal the data’s underlying structure.

Given the aforementioned definition of data visualization’s intended use, the following two crucial conclusions may be drawn:

  • A technique for making data available Keeping things straightforward is the best approach to make something accessible. It is important to consider the context of the word “simple” in this sentence because what is simple for a ten-year-old may not be simple for a Ph.D. holder. Data visualization is a method for making data available to anybody it may affect.
  • A means of communication: This lesson builds on the first. Everyone in the room needs to be speaking the same language for communication to be successful. Regardless of whether you are working alone or in a group, visualizations should yield valuable insights for anyone who may see them. A CEO might choose insights that offer specific actions, whereas a machine learning team might favor insights into the performance of their models.

Data visualization, in short, is a method used to make it simpler to spot patterns or trends in data. Why, then, does this matter so much to data scientists? In the part after this, we shall address this.

Data Visualization Tools

Data professionals, such as data scientists and analysts, will frequently use data visualization tools as this improves their productivity and ability to explain their results. The tools can be divided into two groups: (1) code-free tools, and (2) code-based tools. Let’s examine some well-liked tools from each category.

Code-Free Tools

Not every employee in your company will be technologically competent. You shouldn’t let your inability to program stop you from drawing conclusions from the data, though. Data literacy is the capacity to read, write, communicate, and reason with data to make better data-driven decisions. It is possible to lack programming skills and still be data literate. Code-free tools are a viable alternative for those who may not be proficient programmers, yet those who are may still choose to use them. Code-free tools are graphical user interfaces with the ability to execute native scripts to analyze and enhance the data, to put it more precisely.

Examples of code-free tools are:

Power BI

Power BI

Microsoft’s Power BI is a very well-liked tool for data visualization and business intelligence. It is one of the most widely used reporting, self-service analytics, and predictive analytics business intelligence platforms in the world. You can easily clean, analyze, and start discovering insights into your organization’s data with our platform service. Consider beginning your study of Power BI with Datacamp’s Power BI Fundamentals skill track if you’re interested in doing so.

Tableau

Tableau

Tableau is also one of the world’s most popular business intelligence tools. Its simple drag-and-drop functionality makes it easily accessible for anyone to begin finding insights into their organization’s data using interactive data visualizations. 

Python data visualization

Python Packages

Python is a general-purpose, high-level, interpreted programming language [source: Wikipedia]. It provides a number of excellent graphing tools for data visualization, including:

  • Matplotlib 
  • Seaborn 
  • Plotly
  • ggplot 
  • Bokeh
  • Geoplotlib

Importance of Data Visualization

Businesses need data visualization to help them quickly spot data trends, which would otherwise be difficult. Analysts can visualize ideas and novel patterns thanks to the visual representation of data sets. Without data proliferation, which includes data visualization, it is hard to make sense of the quintillion bytes of data that are being generated every day.

Understanding your data has advantages for every professional industry, hence data visualization is expanding to all industries that have data. Information is the most important leverage for every organization. One can effectively make their points and use such knowledge by using visualization.

1. Performing a Better Analysis of the Data

Business stakeholders can concentrate on the areas that need attention by analyzing reports. The visual mediums aid analysts in comprehending the crucial information required for their line of work. Whether it’s a sales report or a marketing strategy, a visual depiction of the data helps businesses make better analyses and decisions that enhance revenues.

2. Quicker judgment

Making tabular formats and reports laborious for humans to process in favor of images. Decision-makers can move fast based on fresh data insights if the data is well-communicated, accelerating both decision-making and corporate growth.

3. Understanding Complicated Data

Business users can utilize data visualization to understand their massive data sets. They gain by being able to spot fresh patterns and data mistakes. The users can focus on locations that show red flags or progress by making sense of these patterns. This procedure then propels the company forward.

Credible Impact of Data Visualization on Businesses

The industries are becoming dominated by big data. Huge data strips are transformed into useful data points via business intelligence. By swiftly presenting the facts to a human brain, data visualization is contributing to information transfer.

Visualization has a lot of aesthetic value and can express and communicate a clear message.


Without data visualization, firms for which data is the single most important factor will begin to fail. Data visualization’s competitive advantages can make or kill an organization. We must acknowledge that there are no short cuts to decision-making in this day and age that don’t involve displaying the facts.

Who uses data visualization?

Regardless of sector or size, all business types employ data visualization to make their data more engaging. Visualizations provide businesses with crucial insights into their KPIs, preventing any unanticipated losses of information.

Companies can target new markets and demographics for prospects with interactive data visualizations, and they can also boost sales from their current clientele. More businesses are realizing how important web data and visualization tools and approaches have become since more than half of all worldwide advertising sales are now done online.

Why Every Company Needs a Data Visualization

Every business today handles enormous amounts of data every day. No firm can afford to downplay the significance of data visualization in this situation.

Without it, no one would be able to understand what was happening, let alone develop plans employing these enormous amounts of data. We now take data visualization for granted since it is so widespread.

The problem is that if your rivals are using this crucial tool more effectively than you are, your company may be in trouble. Here’s why.

Data Visualization Bevefits

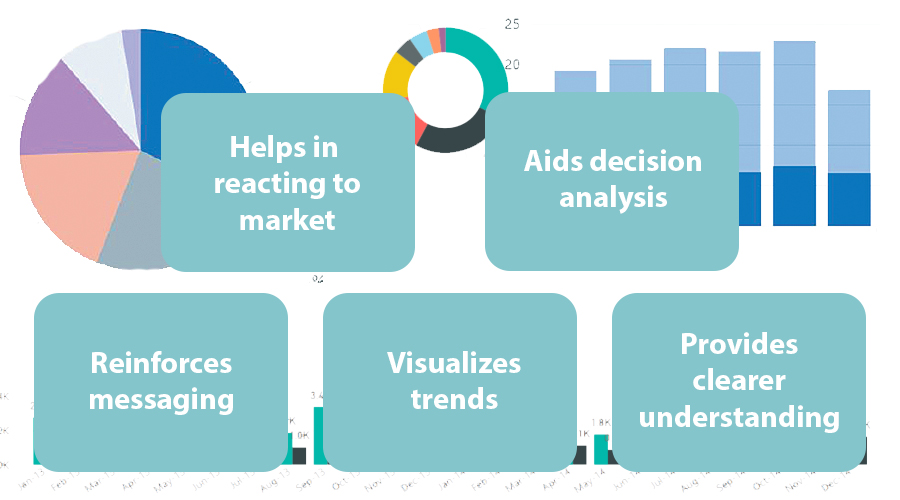
Reinforces messaging

Visual resources have a greater impact than any text-based resource since they are much easier to comprehend and remember. Using dynamic images to support your statistics and information helps your audience understand the point you’re trying to make.

Having said that, it is equally crucial to select the appropriate visualization for the information you are presenting. Visualizations done incorrectly or poorly confuse and overwhelm the viewer, which is wholly ineffective.

Data Visualization and trends

The capacity to recognize various trends across time is one of data visualization’s most evident but important advantages.

You need to use your historical and current data in order to estimate your items, sales, or any other KPI. You can learn everything you need to know about your present industry position and what you might be able to accomplish in the future by identifying current trends and projecting future ones.

Provides clearer understanding

You can quickly handle a lot of information thanks to data visualization, which gives you accurate and in-depth insights into the crucial areas of your organization. Additionally, it enables you to successfully and clearly communicate all of this information to your audience.

The most important stakeholders aren’t necessarily knowledgeable about every facet of their organizations. When done correctly, data visualization gets leaders up to speed on all KPIs, enabling them to act swiftly and intelligently. In that regard, data visualization is also one of the most important tools for bridging departmental gaps inside a company.

Helps decision-makers react to the market

Analysts and decision-makers may react swiftly to any significant changes and avoid mistakes when a company’s KPIs are reliably tracked and clearly shown on practical real-time dashboards.

Early trend detection enables companies to take appropriate action – to ride or exit a market wave metaphorically — in order to maximize gains or minimize losses.

Aids decision analysis

Major commercial decisions are now rarely made on a whim, but rather are the result of thorough evaluations supported by the available facts and information. The greatest decisions are made for your organization when these assessments are then represented through precise, unbiased visual tools.

Since accurate results must constantly be communicated, it is crucial to incorporate complete, unbiased data into your decision-making workflows as well as to consistently and dynamically update charts and graphics.

It can help you win favor with Google

You may improve your SEO tactics and attract more visitors to your website by using data visualization.

Without data research, it is impossible to determine which SEO keywords are most effective for your website. When your website has the most relevant keywords, Google considers it to be relevant and moves it up the SERP ranks.

Data visualizations will not only show you which keywords are bringing in the most hits immediately, but also which ones are keeping visitors on your page. These are additional elements that influence how favorably Google algorithms assess your website.

It’s interesting to note that Google has seen a rise in demand for visual representations. So long as your website provides users with what they’re looking for, you’re good to go.

Data Visualization helps you understand your weaknesses

Data may keep your organization from going backward in addition to assisting you in moving forward.

Data visualization makes sales slumps or peaks in consumer complaints obvious. You can determine what went wrong and how to prevent it from happening again by paying attention to these and looking for matching elements.

Graphs and charts clearly show where the strong and weak points of your company are, allowing you to concentrate more on the areas that require attention.

By gathering information about your rivals, you can quickly identify the areas where they are outperforming you and take the initiative to close the gap.

Small details like how frequently they write blogs and promos, the types of people they target, and how they use social media can tell you a lot about why they are outperforming you in some areas.

Data Visualization can help you predict the Future

Data specialists excel at identifying patterns in your sector and business. You can practically look into the future and make plans as a result of their work.

They organize the data and make sense of it so that it serves your corporate objectives. You can make plans using a visualization that demonstrates higher sales of one product in your industry at a specific time of year. To draw in more customers, you can place additional orders for stock and step up your marketing efforts there.

You might stock up on towels or sarongs as ancillary items to boost sales if you anticipate selling more bikinis in March. You might promote giving away a bottle of sunblock with every transaction. It goes without saying that planning is lot simpler when you are aware of what is coming.

On the other hand, you can discover that customers purchase winter goods in the summer in an effort to profit from lower costs.

Avoid assuming anything about your business. Without evidence to support it, it’s impossible to forecast how customers will act.

DynamoDB Query – All The Knowledge You Need

DynamoDB Query – All The Knowledge You Need

Amazon DynamoDB Query – let’s find out

DynamoDB Query

What is DynamoDB?

The hosted NoSQL database DynamoDB is made available by Amazon Web Services (AWS). It provides:

  • scalable performance that is reliable;
  • a managed experience, preventing the need for SSH access to servers to update the cryptographic libraries;
  • a compact, straightforward API that supports both basic key-value access and sophisticated query patterns.

The following use cases suit DynamoDB extremely well:

Applications with severe latency constraints and high data volumes. JOINs and sophisticated SQL techniques can make queries slower as your data volume grows. Your queries will execute with predictable latency using DynamoDB, even if they are above 100 TBs in size!

Utilizing AWS Lambda, serverless applications. In reaction to event triggers, AWS Lambda offers auto-scaling, stateless, ephemeral compute. Building Serverless applications is a fantastic fit for DynamoDB because it supports authentication & authorisation using IAM roles and is accessible via an HTTP API.

Sets of data with well-known, basic access patterns. DynamoDB is a quick, dependable option if you’re creating suggestions and serving them to users because of its straightforward key-value access patterns.

DynamoDB query process

The hosted NoSQL database DynamoDB is made available by Amazon Web Services (AWS). It provides:

  • scalable performance that is reliable;
  • a managed experience, preventing the need for SSH access to servers to update the cryptographic libraries;
  • a compact, straightforward API that supports both basic key-value access and sophisticated query patterns.

The following use cases suit DynamoDB extremely well:

Applications with severe latency constraints and high data volumes. JOINs and sophisticated SQL techniques can make queries slower as your data volume grows. Your queries will execute with predictable latency using DynamoDB, even if they are above 100 TBs in size!

Utilizing AWS Lambda, serverless applications. In reaction to event triggers, AWS Lambda offers auto-scaling, stateless, ephemeral compute. Building Serverless applications is a fantastic fit for DynamoDB because it supports authentication & authorisation using IAM roles and is accessible via an HTTP API.

Sets of data with well-known, basic access patterns. DynamoDB is a quick, dependable option if you’re creating suggestions and serving them to users because of its straightforward key-value access patterns.

Examples of sort key criteria include the following:

Sr.No

1

2

3

4

5

6

Condition & Description

x = y

It evaluates to true if the attribute x equals y.

x < y

It evaluates to true if x is less than y.

x < y

It evaluates to true if x is less than or equal to y.

x > y

It evaluates to true if x is greater than y.

x > y

It evaluates to true if x is greater thanor equal to y.

x BETWEEN y AND z

It evaluates to true if x is both >=y, and <=z.

Additionally, DynamoDB supports the following operations: begins with (x, substr) (x, substr)

If attribute x begins with the supplied string, it evaluates to true.

The following circumstances must meet specific criteria:

  • Names for attributes must begin with a character from the a-z or A-Z set.
  • An attribute name’s second character must belong to the a-z, A-Z, or 0-9 set.
  • Reserved terms cannot be used in attribute names.

Names for attributes that do not adhere to the aforementioned restrictions can define a placeholder.

The query executes retrievals in sort key order while applying any available condition and filter expressions. An empty result set is always returned by queries when there are no matches.

Results are always returned in ascending order by customizable default, sort key order, and data type order.

Querying with Java

You can query tables and secondary indices using Java queries. They have the opportunity to define sort keys and conditions, but they only require the declaration of partition keys and equality conditions.

Creating an instance of the DynamoDB class, a Table class instance for the target table, and invoking the query method of the Table instance to receive the query object are the usual prerequisites for a query in Java.

An ItemCollection object containing every returned item is included in the answer to the query.

Detail-oriented querying is seen in the example below.

DynamoDB dynamoDB = new DynamoDB (
   new AmazonDynamoDBClient(new ProfileCredentialsProvider()));

Table table = dynamoDB.getTable("Response");  
   QuerySpec spec = new QuerySpec() 
   .withKeyConditionExpression("ID = :nn") 
.withValueMap(new ValueMap() 
   .withString(":nn", "Product Line 1#P1 Thread 1"));
   
ItemCollection<QueryOutcome> items = table.query(spec);  
Iterator<Item> iterator = items.iterator(); 
Item item = null; 

while (iterator.hasNext()) { 
   item = iterator.next(); 
   System.out.println(item.toJSONPretty());
}

There are several other optional arguments supported by the query technique. How to use these parameters is shown in the example below:

Table table = dynamoDB.getTable("Response"); 
QuerySpec spec = new QuerySpec() 
.withKeyConditionExpression("ID = :nn and ResponseTM > :nn_responseTM") 
.withFilterExpression("Author = :nn_author") 
.withValueMap(new ValueMap()
.withString(":nn", "Product Line 1#P1 Thread 1") 
.withString(":nn_responseTM", twoWeeksAgoStr) 
.withString(":nn_author", "Member 123"))
.withConsistentRead(true);
ItemCollection<QueryOutcome> items = table.query(spec); 
Iterator<Item> iterator = items.iterator(); 
while (iterator.hasNext()) { 
System.out.println(iterator.next().toJSONPretty()); 
}

You can also look over the next more extensive example.

Note: The program that follows might use a data source that has already been established. Obtain supporting libraries and build appropriate data sources before attempting to run (tables with required characteristics, or other referenced sources).

The AWS Toolkit, an AWS credential file, and an Eclipse AWS Java Project are also used in this example.

package com .amazonaws .codesamples .document;
import java .text .Simple Date Format;
import java.util .Date;
import java.util. Iterator;
import com. amazonaws. auth. profile. ProfileCredentialsProvider;
import com .amazonaws. services.dynamodbv2.AmazonDynamoDBClient;
import com. amazonaws.services.dynamodbv2.document.DynamoDB;
import com. amazonaws.services.dynamodbv2.document.Item;
import com. amazonaws.services.dynamodbv2.document.ItemCollection;
import com. amazonaws.services.dynamodbv2.document.Page;
import com. amazonaws.services.dynamodbv2.document.QueryOutcome;
import com. amazonaws.services.dynamodbv2.document.Table;
import com. amazonaws.services.dynamodbv2.document.spec.QuerySpec;
import com. amazonaws.services.dynamodbv2.document.utils.ValueMap;
public class QueryOpSample {
static DynamoDB dynamoDB = new DynamoDB(
new AmazonDynamoDBClient(new ProfileCredentialsProvider()));
static String tableName = "Reply"; 
public static void main(String[] args) throws Exception { 
String forumName = "PolyBlaster"; 
String threadSubject = "PolyBlaster Thread 1"; 
getThreadReplies(forumName, threadSubject);
 }
private static void getThreadReplies(String forumName, String threadSubject) { 
Table table = dynamoDB.getTable(tableName); 
String replyId = forumName + "#" + threadSubject; 
QuerySpec spec = new QuerySpec() 
.withKeyConditionExpression("Id = :v_id") 
.withValueMap(new ValueMap() 
.withString(":v_id", replyId)); 
ItemCollection<QueryOutcome> items = table.query(spec); 
System.out.println("\ngetThreadReplies results:"); 
Iterator<Item> iterator = items.iterator(); 
while (iterator.hasNext()) { 
System.out.println(iterator.next().toJSONPretty()); 
} 
} 
}

Finding Every Item with a Specific Partition Key

We discussed working with individual Items at once in our previous chapter. That may be helpful in certain circumstances, such as when working with Users. Whether fetching a User’s profile or updating a User’s name, we typically manipulate one User at a time.

In other circumstances, such as when working with Orders, it is less beneficial. Sometimes we want to grab a certain Order, while other times we might want to show all the Orders for a specific User. For each User’s Orders, it would be inefficient to keep the various partition keys and then query those Items separately.

Let’s look at how the Query API call can be used to fulfill the latter request. We will first gather all of our daffyduck User’s Orders.

$ aws dynamodb query \
--table-name UserOrdersTable \
--key-condition-expression "Username = :username" \
--expression-attribute-values '{
":username": { "S": "daffyduck" }
}' \
$LOCAL

The entire set of Daffy’s Orders is back:

{
"Count": 4,
"Items": [
{
"OrderId": {
"S": "20160630-28176"
},
"Username": {
"S": "daffyduck"
},
"Amount": {
"N": "88.3"
}
},
{
"OrderId": {
"S": "20170608-10171"
},
"Username": {
"S": "daffyduck"
},
"Amount": {
"N": "18.95"
}
},
{
"OrderId": {
"S": "20170609-25875"
},
"Username": {
"S": "daffyduck"
},
"Amount": {
"N": "116.86"
}
},
{
"OrderId": {
"S": "20171129-29970"
},
"Username": {
"S": "daffyduck"
},
"Amount": {
"N": "6.98"
}
}
],
"ScannedCount": 4,
"ConsumedCapacity": null
}

This is quite helpful. We could display all of a User’s Orders on an Orders overview page, with the option for the User to dig down to a specific Order if they so wished.

Using Key Expressions

Instead of returning all Items with a specific HASH key when requesting the return of Items, you might want to further restrict the Items that are returned.

For instance, when creating our table, we determined that we wanted to respond to the question:

Give me every OrderId for a specific Username.

Although this is helpful generally, we might want to add something at the end, similar to the WHERE clause in SQL:

Give me every OrderId for a specific Username that was placed in the last six months.

OR

Please provide me with all OrderIds for a certain Username where the Amount exceeded $50.

There are two ways we might approach this further segmentation. Building the element we wish to query into the RANGE key is the best course of action. This enables us to query our data using Key Expressions, which enables DynamoDB to identify the Items that satisfy our Query rapidly.

Filtering based on non-key properties is a different approach to handling this. Although less effective than Key Expressions, this can still be beneficial under the right circumstances.

We’ll see how to use Key Expressions to filter our findings in this section. We’ve already specified the HASH key we wish to use with our Query using the —key-condition-expression option. A RANGE key value or an expression that operates on that RANGE key can also be included.

Recall that we formatted OrderId as OrderDate-RandomInteger in our RANGE key. We may use the expression syntax to query by order date by starting with the OrderDate in our RANGE key.

For instance, we would ensure that our OrderId was between “20170101” and “20180101” if we needed all Orders from 2017:

aws dynamodb query \
--table-name UserOrdersTable \
--key-condition-expression "Username = :username AND OrderId BETWEEN :startdate AND :enddate" \
--expression-attribute-values '{
":username": { "S": "daffyduck" },
":startdate": { "S": "20170101" },
":enddate": { "S": "20180101" }
}' \
$LOCAL

Our results return three Items rather than all four of Daffy’s Orders:

{
"Count": 3,
"Items": [
{
"OrderId": {
"S": "20170608-10171"
},
"Username": {
"S": "daffyduck"
},
"Amount": {
"N": "18.95"
}
},
{
"OrderId": {
"S": "20170609-25875"
},
"Username": {
"S": "daffyduck"
},
"Amount": {
"N": "116.86"
}
},
{
"OrderId": {
"S": "20171129-29970"
},
"Username": {
"S": "daffyduck"
},
"Amount": {
"N": "6.98"
}
}
],
"ScannedCount": 3,
"ConsumedCapacity": null
}

Daffy’s fourth order was in 2016 so it did not satisfy our Key Expression.

Although there are some restrictions, these Key Expressions are quite helpful in providing more precise query patterns. The necessary information must be directly incorporated into the keys because the Key Expression can only be used with the HASH and RANGE keys. Additionally, it restricts the variety of query patterns you might use. You cannot perform a Key Expression based on the Order Amount if you decide to start your RANGE key with the OrderDate.

Choosing a more specific Query     

The query result is delivering a full Item in the above answers, satisfying our query requirement. In our previous example with tiny Items, it’s not too bad. It can raise your response size in unfavorable ways with larger Items.

A similar —projection-expression option to the GetItem call we previously looked at is available with the Query API function. By doing so, you can restrict the Items to only return the properties that matter to you.

For instance, we might give the following projection expression if we just wanted to return the Amounts for Daffy’s Orders:

$ aws dynamodb query \
--table-name UserOrdersTable \
--key-condition-expression "Username = :username" \
--expression-attribute-values '{
":username": { "S": "daffyduck" }
}' \
--projection-expression 'Amount' \
$LOCAL

And the only information in the reply is the amount:

{
"Count": 4,
"Items": [
{
"Amount": {
"N": "88.3"
}
},
{
"Amount": {
"N": "18.95"
}
},
{
"Amount": {
"N": "116.86"
}
},
{
"Amount": {
"N": "6.98"
}
}
],
"ScannedCount": 4,
"ConsumedCapacity": null
}

Notably, the Count” key in each of the two answers thus far indicates the number of Items that were returned. The —select option will yield the count of Items that satisfy a Query if that is all you want to know:

$ aws dynamodb query \
--table-name UserOrdersTable \
--key-condition-expression "Username = :username" \
--expression-attribute-values '{
":username": { "S": "daffyduck" }
}' \
--select COUNT \
$LOCAL

And the response:

{
"Count": 4,
"ScannedCount": 4,
"ConsumedCapacity": null
}

We went over the fundamentals of the Query API call in this course. Though I believe it to be DynamoDB’s most potent feature, its full potential necessitates proper data modeling.

Python Decorators Lesson – Do You Need New Features in a Ordinary Operation?

Python Decorators Lesson – Do You Need New Features in a Ordinary Operation?

Python decorators

Python Decorators Tutorial

Decorators in Python are used to add new functionality to an object without changing a code. If a part of the program modifies another part of the program at compile time, it is also called metaprogramming. Everything in Python is an object (even classes) so functions are also first class objects. This means that functions can be used or passed as arguments. For classes, decorators are useful because they allow you to dynamically add functionality without creating subclasses and affecting other objects of the class.

Python 3 decorators are one of the most powerful design possibilities, but not that easy. It can be simple to learn how to use decorators, but writing decorators can get complicated. So you can write more powerful code thanks to the usage of decorators.


At first, you need to understand the basic concept that a function is an object. For this, you should know how it is used.


  1. A function can be written to a variable. Therefore, the function can be accessed from this variable.

def func():
    print('KoderShop')
 
variable = func
variable()
 
# Output:
# KoderShop

  1. You can declare a function within another function. But then you won’t be able to access the function outside the outer function.


def outer_func():
def inner_func():
print('KoderShop')
inner_func()

outer_func()

# Output:
# KoderShop

3. A function can be returned by another function.

def outer_func():
text = 'KoderShop'
def inner_func():
print(text)
return inner_func

variable = outer_func()
variable()

# Output:
# KoderShop

  1. A function can be used as arguments in another function.

def argument_func():
print('KoderShop')

def func(function):
print('Welcome to')
function()

func(argument_func)

# Output:
# Welcome to
# KoderShop

There are two different kinds of decorators:

  • Python function decorators
  • Class decorator python

Syntax of Decorator in Python

Decorator is a function that as an argument takes another function, adds additional functionality, and then returns a new version of that function.

A Python function decorator usually is called first and then a definition of a function you want to modify. It is similar to the function inside another function that you saw earlier.

def decorator_func(function):
def wrapper_func():
# Something before the function
function()
# Something after the function
return wrapper_func

return wrapper

Python decorator takes a function as an argument, therefore you should define a function and pass it to the decorator. Also you can set the function to a variable.

def func():
return 'KoderShop'

variable = decorator_func(func)
variable()

However, in Python you can use the @ symbol before the function you would like to decorate. With this decorator function in Python becomes much easier.

@decorator_func
def func():
return 'KoderShop'

func()

Python decorator example:

def example_power(function):
def temp(a, b):
print(a, "powered by", b)
if b == 0:
print("Whoops!")
return
return function(a, b)
return temp

@example_power
def power(a, b):
print(a**b)

power (2, 3)

Python Decorator with Arguments

Arguments can be passed to decorators. If you want to add arguments to decorators you need to add *args and **kwargs to the inner functions.

  • *args can take arguments of any type, such as True, 14 or ‘KoderShop’.
  • **kwargs can take keyword arguments, such as count = 100 or name = ‘KoderShop’.

Syntax of decorator:

def decorator_func(func):
def wrapper(*args, **kwargs):
# Something before the function.
func(*args, **kwargs)
# Something after the function.
return wrapper

@decorator_func
def func(arg):
pass

Python Decorator Order

You do not need to use only one decorator. You can use both simultaneously. Or not only two… Anyway, here you can see the simple Python decorator tutorial:

def row_of_symbols1(function):
def limits():
print('*' * 30)
function()
print('*' * 30)
return limits
def row_of_symbols2(function):
def limits():
print('#' * 20)
function()
print('#' * 20)
return limits

@row_of_symbols1
@row_of_symbols2
def example():
print("Hello KoderShop!")
example()

# Output:
# ******************************
# ####################
# Hello KoderShop!
# ####################
# ******************************

As we can see the octothorpes (#) are sandwiched by asterisks(*). So it leads us to the only conclusion that in Python the order of decorators that are used in the pie looking way matters. Row_of_symbols1 is first so the asterisks are first.

Built-in Decorators in Python

Does Python have built-in decorators? Factually, yes, it has. But, decorators don`t differ from general functions. Decorators are the only fancier way to call functions.

def f(): 
# ...

f = method(f) 

@method 
def f():

So any built-in function can be used as a decorator.

@property Decorator Python

One of the built-in external decorators is @property. It is similar to the property() function in Python. We can use it to have special functionality to methods and make them act as getters, setters or even deleters in defining properties in a class.


For instance, we are modeling a class with the name PC (Personal Computer):

class PC:
def __init__(self, price):

self.price = price

As we can see, this attribute is public as it doesn`t have an underscore. So that means anyone in the developer team can access and change the attribute anywhere in the program:

element.price
element.price = 1000

Here we have ‘element’ that is a reference for instance in class ‘PC’. Anyway it works greatly. But if you want to make this attribute protected, you will make it in a different way. Here getters and setters come.


You should change the whole look of the code to make it done. The code will be like this:


element.get_price()
element.set_price = 1000

And exactly now the @property Python class decorator can be used.

@property Syntax

class PC:
def __init__(self, price):
self._price = price

@property
def price(self):
return self._price

@price.setter
def price(self, example_price):
if example_price > 0 :
self._price = example_price
else:
print("Please enter another price")

@price.deleter
def price(self):
del self._price

def __init__(self, price):
self._price = price

Here we can see that initialization we have written with underline. It means that our price attribute is protected and it shows other developers that it can`t be modified directly outside the class.


For having access with the decorator in class Python to this attribute`s value we used @price.getter, for setting our value we used @price.setter and @price.deleter to delete this instance of attribute. And the question is: why have we done that?

Using @property we do not need to change the value of the class attribute directly inside the code of the class. We can change it a lot of times as we want and without any changes of the class syntax.

@property
def price(self):
return self._price

Getter Syntax Explanation

It’s our method that gets the value. @property text is used to identify for us that we are making properties. def price(self) we use to access and modify the attribute outside of the class. It takes the parameter self that is used for reference to the instance. return self._price is used for returning the value of a protected attribute.

Decorator example Python:

pc = PC(1000)
print(pc.price)
# Output:
# 1000

As we can see, now we have access to the price as if it was public. But we are not changing any syntax of the class.

Setter Syntax Explanation

@price.setter
def price(self, example_price):
if example_price > 0 :
self._price = example_price
else:
print("Please enter another price")

If we need to change the value we need to write the setter class method Python decorator. As the name says @price.setter is the setter. It writes using the name of the attribute and ‘.setter’. def price(self, example_price): again we use self parameter and we have a second one – example_price. It is the new value that we are assigning to the price.

In the body actually we see the simple if function to check if the new value is more than 0.

Example:

pc = PC(1000)
pc.price = 970
print(pc.price)
# Output:
# 970


Againly, we can see that we don`t change any syntax

Deleter Syntax

@price.deleter
def price(self):
del self._price

Deleting value we can by ‘.deleter’. Here @price.deleter is used to indicate actually that this is the deleter method for the price. Explanation to def price(self) same as to getter. And by using del self._price we delete the instance attribute.

After all these methods we can see that all of them have used the same name of our property.

Example:

pc = PC(1000)
pc.price = 970
print(pc.price)
del pc.price
print(pc.price)
# Output:
# 970
# AttributeError: 'PC' object has no attribute '_price'

We can see that the error message comes up when we try to access the price property.

@staticmethod Python Decorators Explained

In Python a built-in decorator that defines a static method is one of the Python class decorators and is called @staticmethod. A static method is called by an instance of a class or by the class itself. Also it cannot access the properties of the class itself, but It can return an object of the class.  A static method can be called using class_name.method_name(). @staticmethod can be useful if you need a function that doesn’t access any properties of a class but it belongs to this class, you can use a static function.

Function Decorations with @staticmethod

class Class_name:
@staticmethod
def method_name(arg1, arg2, arg3, ...): ...

Example:

class PC:
def __init__(self):
self.price = 1000

@staticmethod
def example():
print("Buy PCs in KoderShop!")

PC.example()

PC().example()

pc = PC()
pc.example()

# Output:
# Buy PCs in KoderShop!

@classmethod

In Python a built-in decorator, which returns a class method for a function is called @classmethod. This function is a method that is bound to a class rather than its object. Also class methods can be called with an object or with a class (class_name.method_name() or class_name().method_name()). Unlike a static method, a class method is attached to a class with the first argument as the class itself cls, so @classmethod always works with the class.

Function Decoration with @classmethod

@classmethod
def method_name(cls, arg1, arg2, ...): ...

Example:

class PC:
videocard = 'Nvidia RTX 4080'
cpu = 'AMD Ryzen 9'
def __init__(self):
self.price = 1000

@classmethod
def example(cls):
print("PC attributes are:", cls.videocard, ',', cls.cpu )

PC.example()

# Output:
# PC attributes are: Nvidia RTX 4080 , AMD Ryzen 9

Use of Decorators in Python

To conclude, we can say that a decorator function python can be used when we need to change the behavior of a function without modifying it. The answer to the question “where can we use decorators?” can be very wide, but a few good examples are when you want to add logging, test performance, perform caching, verify something, and so on. You can also use one when you want to repeat the code on multiple functions.


Sometimes decorators can be used to short your code a bit. For example instead of:

def example(ID, name):
if not (exampletype(ID, 'uint') and exampletype(name, 'utf8string')):
raise exampleexception() ...

You just use:

@accepts(uint, utf8string)
def example(ID, name):
...

And the accepts() decorator does all the work for us. So the conclusion is: choose your own decorator that will help you solve the exercise.

Debugging Decorators Python

Decorator is a very useful feature that can be used to modify different functions. However, some errors can appear in this process. When you change a function to a decorator the metadata of this function gets lost.

Lets see the program below but here we have decorate used in another way than usual:


def example_question(func):
def wrapper():
"""Returns a question message"""
neutral_message = func()
happy_message = neutral_message + " Where are you from?"
return happy_message
return wrapper

def speak():
"""Returns a Hi! message"""
return "Hi!"

example_message = example_question(speak)

print(example_message(),'\n')
print(speak.__name__, '->', speak.__doc__) 
print(example_message.__name__, '->', example_message.__doc__)
#Output:
#Hi! Where are you from? 
#
#speak -> Returns a Hi! message
#wrapper -> Returns a question message

When you try to access metadata of the example_message function it returns the metadata of the function wrapper that is inside the decorator.

Python provides a @functools.wraps decorator to solve this problem. This decorator helps you to copy the lost metadata of the undecorated function:

import functools
def example_question(func):
@functools.wraps(func)
def wrapper():
"""Returns a question message"""
neutral_message = func()
happy_message = neutral_message + " Where are you from?"
return happy_message
return wrapper

def speak():
"""Returns a Hi! message"""
return "Hi!"

example_message = example_question(speak)

print(example_message(),'\n')

print(speak.__name__, '->', speak.__doc__) 
print(example_message.__name__, '->', example_message.__doc__)
#Output:
#Hi! Where are you from? 
#
#speak -> Returns a Hi! message

@wrapper Python

Function wrappers are also known as decorators, which are a very useful tool in Python because they allow to change the behavior of a function or a class. Decorators allow us to wrap functions to extend the behavior of the wrapped function. In decorators, functions are taken as arguments to another function and then called inside the Python wrapper function.

@wrapper
def function(func1):
example(func2)

This example is also similar to:

def function(func1):
example(func2)

function = wrapper(function)

Qualitative Data vs Quantitative – Let’s Look Deeper

Qualitative Data vs Quantitative – Let’s Look Deeper

Qualitative Data vs Quantitative

Data Demystified: Qualitative Data vs Quantitative

Decide whether you’re going to employ a qualitative or quantitative research strategy now. And, chances are, you want to choose the one that fills you with the least amount of dread. The engineers may be drawn to quantitative approaches because they dislike interacting with people and handling “soft” issues and find numbers and algorithms to be much more comfortable. On the other hand, because they literally have the opposite anxieties, anthropologists are presumably more interested in qualitative methodologies.
But using “fear” as a justification for your research is not a wise course of action. Your methodology needs to be informed by your research aims and objectives, not your comfort zone. Plus, it’s quite common that the approach you feared (whether qualitative or quantitative) is actually not that big a deal. Research methodologies can be mastered (typically a lot faster than you expect) and software simplifies a lot of the complexity of both quantitative and qualitative data analysis. On the other hand, picking the incorrect strategy and attempting to squeeze a square peg into a round hole would only lead to even greater suffering.

In this essay, I’ll discuss the qualitative vs quantitative option in basic, plain language with heaps of examples. Although you won’t become an expert in either field as a result of this, you should have enough of a “big picture” understanding to be able to choose the best research methodology

Qualitative: The Basics

Qualitative data, as contrast to quantitative data, cannot be counted or quantified. It is descriptive and uses language to describe ideas rather than numbers.

For an explanation of “Why?,” researchers frequently turn to qualitative data, or “How?” inquiries. For instance, you might want to analyze why a certain website visitor abandoned their shopping cart three times in one week if your quantitative data indicates that they did so. To do this, you might need to get some type of qualitative information from the user. Perhaps you are interested in knowing how a user feels about a specific product; in this case, qualitative data can offer these insights. In this situation, you’re not just looking at numbers; you’re also asking the user to explain their actions or feelings to you in English.

The terms or labels used to define certain qualities or traits—such as characterizing the sky as blue or designating a specific flavor of ice cream as vanilla—are sometimes referred to as qualitative data.

Let’s take a look at the example below:

The water is hot.
Let’s explore that further. What exactly does the phrase mean? Is it helpful, too?

The response is: well, it depends. You’re out of luck if you want to know the water’s precise temperature. But if you put on your qualitative hat and try to understand how someone feels about the temperature of the water, that line can tell you a lot.

Because of their deeply held, relationship-destroying beliefs about water temperature, many husbands and wives have never shared a bath together (or so I’m told). Additionally, while analyses of the inevitable arguments and disagreements over water temperature would more comfortably fit in the category of “qualitative research,” divorce rates resulting from differences in how people perceive water temperature would more appropriately belong in “quantitative research.” This is because by methodically coding and analyzing the data, qualitative research enables you to comprehend people’s perceptions and experiences.

Those heated debates can be examined in a variety of ways using qualitative research. From focus groups to interviews to direct observation (ideally outside the bathroom, of course). The way the argument develops or the emotional language used during the discussion may be of interest to you as the researcher. You might be more interested in the body language of someone who has been repeatedly dragged into (what they perceive to be) scalding hot water during what was supposed to be a romantic evening than you are in the actual words. Qualitative research can help us better understand all of these “softer” elements.

Qualitative research may be quite rich and thorough in this approach, and it is frequently used as a foundation for developing ideas and spotting trends. In other words, as opposed to confirmatory research, it works well for exploratory research (for instance, when your goal is to learn what individuals believe or feel) (for example, where your objective is to test a hypothesis). To better understand human perception, worldview, and the way we describe our experiences, qualitative research is used. It’s about studying and understanding a large issue, often with very little preconceived beliefs as to what we may uncover.

Quantitive: The Basics

Any information that can be quantified is referred to as quantitative data. Quantitative data can be counted, measured, and assigned a numerical value. Quantitative information can provide you with “how many,” “how much,” or “how often” information. For instance, how many people viewed the webinar last week? How much money did the business bring in in 2019? How frequently does a certain clientele utilize internet banking?

You’ll do statistical studies to examine and interpret quantitative data.

Lets take a look at the example below:

The water is 45 degrees Celsius.

What does this mean, exactly? What is the use of this?


Someone who I am absolutely not married to once informed me that he frequently takes cold showers. This seems completely absurd to me because I’m frightened of anything that isn’t body temperature or above. But this begs the question: what temperature makes the ideal bath? Or, at the very least, what is the average temperature of baths? (Obviously assuming they are bathing in water that is perfect for them.) You must now put on your quantitative hat in order to respond to this question.

We could determine the average temperature for each person if we asked 100 people to record the temperature of their bathwater over the course of a week. Let’s say, for example, that Jane averages 46.3°C. Billy averages 42 degrees Celsius. Some folks might enjoy the unnatural chill of 30°C on a typical weekday. And some of those will be aiming for the 48°C threshold, which is reportedly the legal maximum in England (now there’s an interesting fact for you).

There are many different approaches to analyze this data using a quantitative approach. For instance, we may examine these data to determine the average temperature or to see how widely the temperatures range. We could check to see whether there are major differences in optimal bath water temperature between the sexes or if aging has any bearing on this! We could plot this data on interesting, eye-catching graphs and use esoteric terms like “eigenvalues,” “significant,” and “correlation.” There are countless opportunities to geek out…

This is how quantitative research frequently entails going into the study with some amount of anticipation or comprehension of the results, typically in the form of a hypothesis that you want to test. For instance:

Theoretically, men like taking baths in water that is warmer than women.

Statistical analysis can then be used to examine this hypothesis. The data might support the hypothesis or might show that there are some subtleties in terms of people’s preferences. Men, for instance, might prefer a hotter bath on particular days.

As you can see, each qualitative and quantitative research method serves a distinct purpose. They are merely different tools for a variety of tasks.

What are the main differences between quantitative and qualitative data?

Differences between quantitative and qualitative data

Quantitative and qualitative data differ primarily in what they reveal, how they are gathered, and how they are examined. Before delving deeper into each distinction, let’s briefly review the main differences:

  • Quantitative information is measurable or countable and has to do with numbers. Qualitative data is linguistically descriptive.
  • Quantitative data provides information about quantity, amount, or frequency (for example, “20 people subscribed to our email newsletter last week”). Qualitative data, such as “The mailbox is red” or “I joined up for the email newsletter because I’m extremely interested in hearing about local events,” might help us understand the “why” or “how” behind particular behaviors. It can also just describe a particular aspect.
  • While qualitative data is ephemeral and changeable, quantitative data is static and “universal.” For instance, the fact that something weighs 20 kilograms can be regarded as an objective fact. However, the qualitative accounts of how two people experience the same incident may vary greatly.
  • The collection of quantitative data involves measuring and counting. Qualitative data is gathered through observation and interviewing.
  • While qualitative data is evaluated by categorizing it into relevant categories or topics, quantitative data is analyzed through statistical analysis.

The difference between quantitative and qualitative data:


Example:

Let’s look at an example to show the distinction between quantitative and qualitative data. Think about how you would characterize your best friend. What kind of information could you collect or use to draw a clear picture?

You could start by describing the person’s physical characteristics, such as height, weight, hair color and style, and foot size. You might then go over some of their more notable personality traits. Additionally, you could mention their residence, where they live, how frequently they go swimming, and how many siblings and animals they have (their favorite hobby).

The following information will all fall into either the quantitative or qualitative categories:

Quantitive data:

  • My closest pal is 5 feet 7 inches tall.
  • Their feet are a size 6.
  • They are 63 kilos heavy.
  • One of my best friend’s siblings is older, and she has two younger siblings.
  • They own two felines.
  • My closest friend is located 20 miles away.
  • Each week, they swim four times.

Qualitative data:

  • Curly brown hair belongs to my best pal.
  • Their eyes are green.
  • My best friend is noisy, witty, and an excellent listener.
  • Additionally, they might occasionally be impetuous and irritable.
  • A crimson automobile is driven by my best friend.
  • They exude friendliness and have an infectious chuckle.

Of course, you’ll deal with a lot more complicated data than the ones we’ve provided when working as a researcher or data analyst. But maybe our “best buddy” example has helped you recognize the difference between quantitative and qualitative data.

Different types of quantitative and qualitative data

When considering the difference between quantitative and qualitative data, it helps to explore some types and examples of each. Let’s do that now, starting with quantitative data.

Types of quantitative data (with examples)

Quantitative information might be continuous or discontinuous.

  • Data that is discrete quantitatively expressed has set numerical values and cannot be further subdivided. When you count something, like the number of individuals in a room, you are using discrete data. 32 people make this a fixed and finite number.
  • Quantitative data that is continuous can be divided indefinitely into smaller units and plotted on a continuum. It can be any number; for instance, a piece of string could be 20.4 cm long or the temperature in the room could be 30.8 degrees.

What are some real-world examples of quantitative data?

Typical instances of quantitative data include the following:

  • dimensions like weight, length, and height
  • Counts like the volume of sales, internet visitors, or email signups
  • computations, like revenue
  • Projections, such as anticipated sales or a forecast percentage growth in revenue
  • Quantification of qualitative data, such as obtaining an overall customer satisfaction score by having customers assess their satisfaction on a scale of 1 to 5

Types of qualitative data (with examples)

Nominal or ordinal data types can be used to classify qualitative data:

  • Certain variables are labeled or categorized using nominal data without being given any kind of quantitative value. For instance, you could want to know where your target audience resides if you were gathering data on them. Are they based in Australia, Asia, the USA, the UK, or another country? These geographical divisions are all considered notional data. Another straightforward illustration is the description of eye color using terms like “blue,” “brown,” and “green.”
  • When the categories used to categorize your qualitative data fall into a natural order or hierarchy, it is said to have ordinal data. It’s obvious that “outstanding” is better than “poor,” but there’s no way to measure or quantify the “distance” between the two categories. As an illustration, if you wanted to investigate customer satisfaction, you might ask each customer to select whether their experience with your product was “poor,” “satisfactory,” “good,” or “outstanding.”

Ordinal and nominal data frequently appear when conducting questionnaires and surveys. But qualitative data also includes unstructured data, such as what individuals say in an interview, what they write in a product review, or what they post on social media. It is not just restricted to labels and categories.

What are some real-world examples of qualitative data?

Examples of qualitative data are as follows:

  • Transcripts of interviews or audio files
  • Text that appears in emails or social media posts
  • Product evaluations and client endorsements
  • Descriptions and observations, such as “I saw the teacher was wearing a red jumper.”
  • Survey and questionnaire labels and categories, such as choosing whether you are content, dissatisfied, or neutral with a specific good or service

How are quantitative and qualitative data collected?

The method of data generation or collection is one of the main distinctions between quantitative and qualitative data.

How is quantitative data generated?

Calculations, measurements, and counting of particular things are used to provide quantitative data. Typical techniques for gathering quantitative data include:

  • Surveys and questionnaires: This approach is particularly helpful for acquiring a lot of data. You could send out a survey asking workers to assess various aspects of the company on a scale of 1 to 10, if you wanted to collect quantitative information on employee satisfaction.
  • Analytics tools: Data scientists and analysts collect quantitative data from a variety of sources using specialized tools. For instance, Google Analytics collects data in real-time, enabling you to quickly analyze all the most crucial website metrics including traffic, page views, and average session length.
  • Environmental sensors: A sensor is an electronic device that monitors changes in the environment and transmits that data to another electronic device, typically a computer. This data is numerically transformed, resulting in a steady stream of quantitative information.
  • Manipulation of previously collected quantitative data: Researchers and analysts may also produce new quantitative data by analyzing or calculating previously collected quantitative data. For instance, you could create new quantitative data by calculating the entire profit margin if you have a spreadsheet with information on the quantity of sales and expenditures in USD.

How is qualitative data generated?

Through observations, surveys, and interviews, qualitative data is acquired. Let’s examine these techniques in greater detail:

  • Interviews are a terrific method to find out what people think about any subject, whether it be their experiences with a certain service or their thoughts on a new product. You will eventually receive interview transcripts after conducting interviews, which you may then examine.
  • Additionally, questionnaires and surveys are employed to collect qualitative data. If you wanted to gather demographic information about your intended audience, you could invite them to fill out a survey where they could either choose their answers from a range of alternatives or just type them down in freeform.
  • Observations: Collecting qualitative data doesn’t always need you to interact with individuals directly. Additionally, analysts will look at “naturally occurring” qualitative data, such as comments made in product reviews or things individuals post on social media.

Analysis techniques for qualitative versus quantitative data

The manner in which they are examined is another significant distinction between quantitative and qualitative data. While qualitative data is typically evaluated by classifying it into useful categories or themes, quantitative data is better suited for statistical analysis and mathematical calculations.

Quantitative data analysis

The type of data you’ve collected and the insights you hope to glean will determine how you analyze your quantitative data. In addition to many other things, statistical analysis can be used to spot trends in the data, determine whether a group of variables are related in any way (e.g., does social media spending correlate with sales), calculate probability in order to precisely predict future outcomes, comprehend how the data is distributed, and much more.

Some of the most popular methods used by data analysts include:

  • Regression analysis
  • Monte Carlo simulation
  • Factor analysis
  • Cohort analysis
  • Cluster analysis
  • Time series analysis

What are the advantages and disadvantages of quantitative vs qualitative data?

When conducting any kind of study or gathering data for analysis, it’s critical to keep in mind the benefits and drawbacks of each type of data. We’ll now list the key benefits and drawbacks of each.

What are the advantages and disadvantages of quantitative data?

Quantitative data has the advantage of being generally rapid and simple to gather, allowing you to work with huge samples. Quantitative data is objective and less prone to bias than qualitative data, making it simpler to reach trustworthy and applicable generalizations.

Quantitative data’s fundamental drawback is that it sometimes lacks context and depth. It’s not always clear from the stats what’s going on; for instance, you might find that you lost 70% of your newsletter subscribers in a single week, but you won’t know why unless you look into it further.

What are the advantages and disadvantages of qualitative data?

Qualitative data excels where quantitative data fails. The main benefit of qualitative data is that it provides in-depth, comprehensive insights and enables you to investigate the context of a particular topic. If you want to understand how your target audience behaves and run any kind of organization, you need to be able to accurately evaluate how people feel and why they do certain things through qualitative data.

However, gathering qualitative data can be more difficult and time-consuming, so you might end up using fewer samples. It’s critical to be mindful of bias when conducting qualitative analysis since qualitative data is prone to interpretation due to its subjective nature.

When should I use qualitative or quantitative data?

Simply said, your data analytics project will determine whether you employ qualitative, quantitative, or a combination of both types of data. We’ll talk about which projects work best with different types of data here.

To decide whether to employ qualitative data, quantitative data, or a mixed methodologies approach to gathering data for your project, you can generally use the following criteria.

  • Do you want to comprehend a certain idea, event, or point of view? Use qualitative information.
  • Do you want to validate or put to the test a theory or a hypothesis? Utilize numerical data.
  • Do you conduct research? A mixed approaches approach to data collection could be advantageous.

You might discover that both sorts of data are frequently employed in projects to get a clear overall picture—integrating both the human and numerical sides of things.

Thoughts:

We defined quantitative and qualitative data and described how they differed throughout this piece. In essence, qualitative data is descriptive and has to do with language, whereas quantitative data is countable or quantifiable and has to do with numbers.

One of the very first stages to being a data specialist is comprehending the distinction between quantitative and qualitative data.