Enterprise Data Strategy Roadmap: Which Model to Choose and Follow

Enterprise Data Strategy Roadmap: Which Model to Choose and Follow

Enterprise sata strategy roadmap

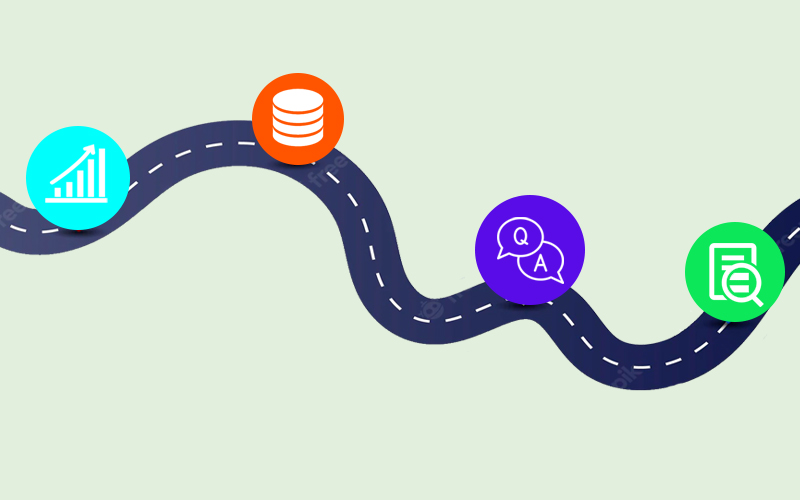
Data Strategy Roadmap

A Data Strategy roadmap is a step-by-step plan for transforming a company from its existing condition to the desired business organization. It is a more extensive, researched version of the Data Strategy that specifies when and how certain improvements to develop and upgrade a business’s data processes should be implemented. A Data Strategy roadmap can help an organization’s processes align with its targeted business goals.

A good roadmap will align the many solutions utilized to update an organization and assist in the establishment of a solid corporate foundation.

The removal of chaos and confusion is a big benefit of having a Data Strategy plan. During the change process, time, money, and resources will be saved. The roadmap can also be utilized as a tool for communicating plans to stakeholders, personnel, and management. A decent road map should include the following items:


  • Specific objectives: A list of what should be completed by the end of this project.
  • The people: A breakdown of who will be in charge of each step of the process.
  • Timeline: A plan for completing each phase or project. There should be an understanding of what comes first.
  • The funding required for each phase of the Data Strategy.
  • The software: A description of the software required to meet the precise goals outlined in the Data Strategy roadmap.

Why Do You Need a Data Strategy Roadmap?

It’s nearly hard to arrive at your end goal if you don’t know where you’re going. Creating a data strategy can assist in breaking down the huge picture into manageable parts. With a roadmap in hand, you’ll always know how far you’ve progressed and whether you’re on schedule.

When developing a data strategy, it is critical to consider all areas of implementation. If you try the monolithic method, you will quickly run out of steam. It’s a good idea to prepare a detailed plan including everything from the project’s scope to its cost before you start any data-related projects.

A data strategy roadmap will allow you to explain to stakeholders and management what you anticipate to achieve. It will also serve as a convenient reference point for any future data initiatives.

Roadmaps can help you envision your approach and keep your entire organization focused on your objectives. Implementing a modern data and analytics platform will improve your organization’s data-driven decision-making process and can assist in transforming big data from a buzzword to a valuable business asset. Just getting started requires a solid understanding of your organization’s goals and the resources needed to achieve them.

Other components of the Data Strategy Roadmap include:


  • The Business Case – Create a business case for implementing a data strategy.
  • Data Governance Strategy – Create an efficient governance system for managing data assets.
  • Data Management Strategy – Determine the resources required to manage the data.
  • Data Quality Assurance Plan – Define best practices for maintaining high data standards for accurate reporting.
  • Plan for Data Analytics – Create a procedure for analyzing data to support decision-making.

Case Study In Business

One of the most important aspects of a data strategy roadmap is defining the business case for a contemporary data platform. The following elements should be included in your business case:


  • What issue does a contemporary data platform address?
  • Are there any extra charges related with the data platform?
  • How much does the total cost of ownership (TCO) cost?
  • What is the expected return on investment (ROI)?
  • What is the deployment timeline?
  • Do we have enough money to finish the project?

Plan For Data Goverance

A solid data governance strategy serves as the foundation for a strong data strategy. You should create a structure for managing your organization’s data assets. You’ll also need to define roles and responsibilities, determine who owns what data, locate the data, and develop policies and procedures for accessing and using the data.

The following aspects should be included in a strong data governance plan:


  • Roles and responsibilities – Explain who will have access to the data, how they will access it, and who will supervise their activities.
  • Data asset ownership – Determine who owns each piece of data and how it will be utilized.
  • Data location – Specify where the data will remain and how it will be accessed.

Plan For Data Management

After you’ve chosen the breadth of your data strategy and the sorts of data you’ll employ, you must select how you’ll manage the data. The data management plan specifies the tools and processes to be used in data management. The following are some important concerns:


  • Data management resources – Make a list of the resources needed to manage the data. Hardware, software, people, and training may all be included.
  • Data classification – Determine the various sorts of data that will be stored. Structured data, such as financial records, and unstructured data, such as emails and text documents, are two examples.
  • Storage options – Select the storage option that best meets your requirements.

Plan For Data Quality Assurance

The data quality assurance strategy specifies the methods and mechanisms that will be utilized to guarantee that the data fulfills your requirements. The following elements are included in a data quality assurance plan:


  • Requirements identification – Describe the standards that must be met before the data can be shared.
  • Metrics definition – Define the metrics that will be used to assess the performance of the data quality program.
  • Data testing methodology – Outline the data testing process.
  • Reporting of results – Report the test results.
  • Process monitoring entails tracking the progress of the data quality program and reporting back to stakeholders.

Plan For Data Analysis

The analytical approaches used to analyze the data are detailed in the data analytics plan. The aspects of an analytics plan are as follows:


  • Process and approach — Your analytical process, from prioritizing to guided navigation to self-service analytics.
  • Data preparation – Describe the actions taken prior to evaluating the data.
  • Define the scenarios that will drive the analytical methodologies using use cases.
  • Describe the business rules and data models that have been applied to the data.
  • Presentation – Explain how the analytics presentation will be used internally and externally.

In conclusion

A data strategy is a plan that describes how businesses will use data to achieve specified business goals. It establishes expectations and provides a clear sense of direction. Creating a data strategy roadmap is a useful tool for assisting with strategy implementation.

Having these expectations outlined in a roadmap engages the entire organization in the journey. This is important for a variety of reasons, the most important of which is that data consumers fully understand the cultural transformation required to become a data-informed organization.

Code Refactoring: Let’s Find Out If This Is Really Necessary | KoderShop

Code Refactoring: Let’s Find Out If This Is Really Necessary | KoderShop

Code refactoring

Code Refactoring: Meaning, Benefits and Practices

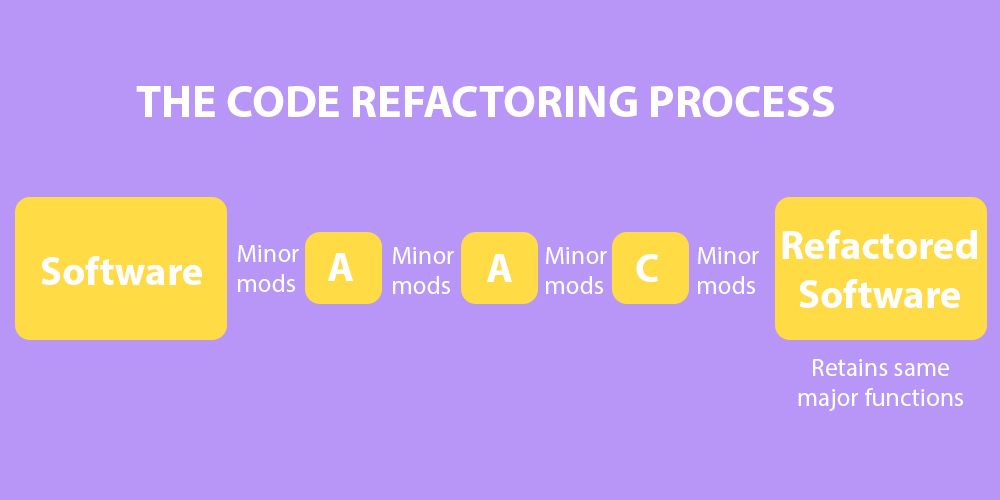
The technique of rearranging code without affecting its original functionality is known as refactoring. Refactoring’s purpose is to improve internal code by making many modest changes that do not affect the code’s exterior behavior.

Refactoring code is done by computer programmers and software developers to improve the design, structure, and implementation of software. Refactoring increases code readability while decreasing complications. Refactoring can also assist software engineers in locating faults or vulnerabilities in their code.

The refactoring process involves numerous minor changes to a program’s source code. For example, one technique to refactoring is to enhance the structure of source code at one point and then progressively extend the same modifications to all appropriate references throughout the program. The thought process is that all of the modest, behavior-preserving modifications to a body of code add up. These adjustments keep the software’s original behavior and do not change it.

In his book Refactoring: Improving the Design of Existing Code, Martin Fowler, considered the father of refactoring, consolidated many best practices from across the software development industry into a specific list of refactorings and described methods to implement them.

A few remarks on code

The most popular definition of clean code is that it is simple to understand and modify. Code is never written once and then forgotten. It is critical for everybody who uses the code to be able to work on it efficiently.

The term “dirty code” refers to code that is difficult to maintain and update. It usually refers to code that was added or altered late in the development process owing to time constraints.

Legacy code is code that was passed down from a previous owner or an earlier version of the software. It could possibly be a code that you don’t understand and that is difficult to update.

Remember that. We’ll get back to this later. And now for the main course: refactoring.

Why is refactoring code important?

All programmers must follow the same rule: the code must be short, well-structured, and clear to the developers who will be working with it. Even after a successful software development project, the system must be improved in order to give new features and solutions. It frequently leads to code complexity since the upgrades are applied in a way that makes updates more difficult. Source code reworking can help to improve the code’s maintainability and readability. It can also aid in the avoidance of standardization issues created by the large number of developers providing their own code. Furthermore, reworking reduces the amount of technical debt that developers build as a result of failing to capitalize on opportunities to improve the code. Technical debt is the cost a company will incur in the future as a result of opting for a simpler, faster, but less reliable option today. Any compromise you make in the present to release products or features faster will result in a greater volume of work to do in the future.

What does refactoring accomplish?

Refactoring makes code better by:

  • By resolving dependencies and complications, we can be more efficient.
  • Increase efficiency and readability to make it more manageable or reusable.
  • Cleaner, which makes it easier to read and understand.
  • It is easier for software developers to identify and remedy problems or vulnerabilities in code.

The code is modified without affecting the program’s functionality. Simple refactorings, such as renaming a function or variable across an entire code base, are supported by many basic editing environments.

Code refactoring process

When is it appropriate to refactor code?

Refactoring can be done after a product has been delivered, before adding updates and new features to existing code, or as part of the day-to-day development process.

When the process is carried out after deployment, it is usually carried out before developers move on to the next project. An organization may be able to rework more code at this point in the software delivery lifecycle because engineers are more available and have more time to work on the necessary source code changes.

However, reworking should be done before adding updates or new features to old code.Refactoring at this point makes it easier for developers to build on top of existing code since they are going back and simplifying it, making it easier to read and comprehend.

When a company understands the refactoring process well, it may make it a regular practice. When a developer needs to add something to a code base, they can examine the existing code to determine if it is structured in a way that makes adding new code simple. If not, the developer may refactor the existing code. Once the new code is added, the developer can refactor the existing code to make it more clear.

When is it not necessary to refactor?

It is often preferable to forego restructuring and instead launch a new product. If you intend to rebuild the app from the ground up, starting from scratch is the best alternative. It avoids the need for refactoring, which can be time-consuming while maintaining the same state.

Another scenario is that if you don’t have tests to verify that restructuring has altered the code, you shouldn’t refactor it.

What are the advantages of refactoring?

Refactoring has the following advantages:

  • Because the purpose is to simplify code and minimize complications, it makes it easier to understand and read.
  • Improves maintainability and makes it easier to identify bugs and make additional modifications.
  • Encourages a deeper grasp of coding. Developers must consider how their code will interact with existing code in the code base.
  • The emphasis remains solely on functionality. The original project does not lose scope by not changing the code’s original functionality.

What are the difficulties of refactoring?

However, difficulties do arise as a result of the process. Some examples are:

  • If a development team is in a hurry and refactoring is not prepared for, the process will take longer.
  • Refactoring can cause delays and extra work if there are no clear objectives.
  • Refactoring, which is designed to tidy up code and make it less complex, cannot address software issues on its own.

Techniques for refactoring code

Different refactoring strategies can be used by organizations in different situations. Here are a few examples:

  • Red and green. This popular refactoring method in Agile development consists of three parts. First, the developers assess what needs to be built; second, they ensure that their project passes testing; and finally, they rework the code to improve it.
  • This technique focuses on reducing code complexity by removing unneeded parts.
  • Changing the appearance of items. This method generates new classes while relocating functionality between old and new data classes.
  • This method divides code into smaller chunks and then moves those chunks to a different method. A call to the new method replaces fragmented code.
  • Refactoring through abstraction. This method decreases the amount of redundant code. When there is a big quantity of code to be refactored, this is done.
  • This methodology uses numerous refactoring methods, including extraction and inline, to streamline code and minimize duplications.

Best techniques for code refactoring

The following are some best practices for refactoring:


  • Prepare for refactoring. Otherwise, it may be tough to find time for the time-consuming practice.
  • First, refactor. To reduce technical debt, developers should do this before adding changes or new features to existing code.
  • Refactor in modest increments. This provides input to developers early in the process, allowing them to identify potential flaws as well as add business needs.
  • Set specific goals. Early in the code reworking process, developers should define the project scope and goals. As refactoring is intended to be a sort of housekeeping rather than an opportunity to change functionality or features, this helps to avoid delays and needless labor.
  • Test frequently. This assists in ensuring that refactored changes do not introduce new bugs.
  • Whenever feasible, automate. Automation tools make refactoring easier and faster, resulting in increased efficiency.
  • Separately address software flaws. Refactoring is not intended to fix software problems. Debugging and troubleshooting should be done independently.
  • Recognize the code. Examine the code to learn about its processes, methods, objects, variables, and other components.
  • Refactor, patch, and update on a regular basis. When refactoring may address a substantial issue without requiring too much time and effort, it generates the highest return on investment.
  • Concentrate on code deduplication. Duplication complicates code, increasing its footprint and squandering system resources.

Concentrate on the process rather than on perfection

The truth is that you will never be completely satisfied with the results of code refactoring. Even so, it’s critical to begin thinking about the process as an ongoing maintenance project. It will necessitate that you clean and organize the code on a regular basis.

Conclussion

Refactoring is a procedure that involves revising the source code of the code. It makes no new features or changes to the underlying system. It’s a practice that helps maintain the code running smoothly and without errors. Another advantage of refactoring is that it allows developers to focus on the details that will drive the solution’s implementation rather than just the code itself.

You can get rid of outdated software applications and improve their overall functionality using proper refactoring techniques without compromising their current state.

OLTP vs OLTP: Their Differences and Comparative Review

OLTP vs OLTP: Their Differences and Comparative Review

OLTP OLAP

OLAP vs. OLTP: The differences?

These terms are frequently used interchangeably, so what are the fundamental distinctions between them and how can you choose the best one for your situation?

We live in a data-driven society, and firms that use data to make better decisions and respond to changing demands are more likely to succeed. This data can be found in innovative service offerings (such as ride-sharing apps) as well as the behemoth systems that run retail (both e-commerce and in-store transactions).

There are two types of data processing systems in the data science field: online analytical processing (OLAP) and online transaction processing (OLTP) (OLTP). The primary distinction is that one employs data to gain meaningful insights, whilst the other is just operational. However, both methods can be used to tackle data problems in meaningful ways.

The challenge isn’t which processing type to utilize, but how to make the best use of both for your situation.

But, what is OLAP?

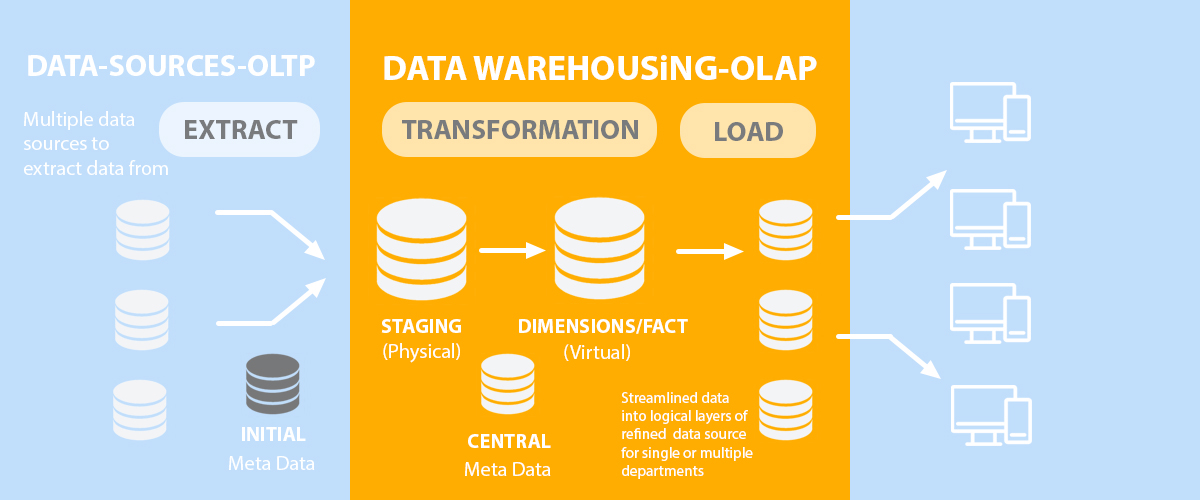
Online analytical processing (OLAP) is a system that does multidimensional analysis on massive amounts of data at rapid rates. This data is typically derived from a data warehouse, data mart, or other centralized data source. OLAP is great for data mining, business intelligence, and complex analytical calculations. As well as financial analysis, budgeting, and sales forecasting roles in corporate reporting.

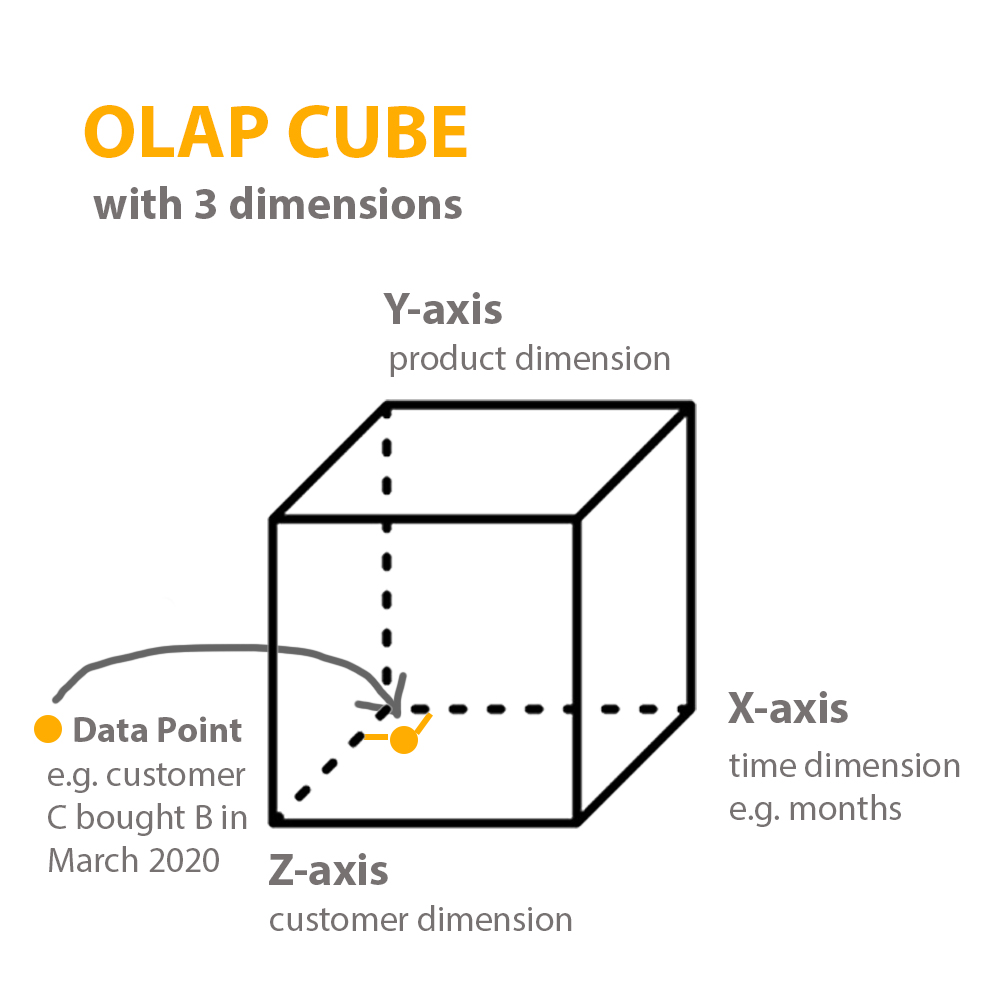
The OLAP cube, which allows you to swiftly query, report on, and analyze multidimensional data, is at the heart of most OLAP databases. What exactly is a data dimension? It is simply one component of a larger dataset. For example, sales numbers may contain multiple variables such as geography, time of year, product models, and so on.

The OLAP cube expands the typical relational database schema’s row-by-column arrangement by adding levels for extra data dimensions. While the cube’s top layer may categorize sales by area, data analysts can “drill-down” into layers for sales by state/province, city, and/or specific stores. This historical, aggregated data is typically kept in a star or snowflake format for OLAP.

OLAP cube

OLAP Types

Although any online analytical processing system uses a multidimensional structure, OLAP cubes come in a variety of shapes and sizes. Only the most well-known are mentioned here:

MOLAP

MOLAP is considered a typical form of OLAP and is commonly referred to as OLAP. The data in this OLAP cube example is kept in a multidimensional array rather than a relational database. Before running the system, pre-computation is required.

ROLAP

Unlike traditional OLAP, ROLAP works directly with relational databases and does not require pre-computation. However, in order to be used in ROLAP, the OLAP cube database must be well designed.

HOLAP

HOLAP, as the name implies, is a synthesis of MOLAP and ROLAP. This type allows users to determine how much data will be saved in MOLAP and ROLAP.

OLAP cube pros and cons

OLAP cubes, like any other BI tool or technique, have pros and limitations. Of course, before deploying this technology, it is necessary to ensure that the advantages of OLAP cubes outnumber the disadvantages.

Cons:

  • High cost: implementing such technology is not cheap or quick, but it is an investment in the future that can pay for itself;
  • The OLAP cube’s main restriction is its computational capabilities. Some systems lack computing power, which severely limits system adaptability.
  • Potential risks: it is not always possible to give large amounts of data, and it is difficult to provide important relationships to decision makers.

Pros:

  • Multidimensional data representation: this data structure allows users to examine information from several perspectives.
  • High data processing speed: An OLAP cube typically executes a typical user query in 5 seconds, saving users time on computations and building sophisticated heavyweight reports.
  • Data that is detailed and aggregated: a cube is organized with multiple dimensions, making it simple and quick to navigate through large amounts of information.
  • Instead of manipulating database table fields, the end user interacts with common business categories such as products, customers, employees, territory, date, and so on.

As you can see, the advantages of OLAP cubes are not only in their increased number, but also in their increased capability. Every tool has risks, but in the case of OLAP cubes, the risks are worth it.

OLAP and data cube applications

To begin working with OLAP cubes, you must first select the appropriate tool. We recommend that you pay attention to the following items from the market’s wide variety:

  • IBM Cognos
  • Micro Strategy
  • Apache Kylin
  • Essbase OLAP cubes

It is also possible to create an OLAP cube with Hadoop, particularly with the Ranet OLAP analytical tool. You can get OLAP cube software for free and use it for a 30-day trial period. However, implementing an OLAP data cube is not the only problem. When working with OLAP cube data, it is necessary to assemble MDX queries and generate current reports. Given the correlation of relations, MDX queries are indeed extremely difficult to create and test on their own. Furthermore, for successful report preparation, a user must be able to navigate the data in a meaningful way and understand how to compile all relevant information. For this purpose, there is a Cubes Viewer, a browser-based visual tool for analyzing and dealing with data in an OLAP system. Ranet OLAP includes a CubesViewer function that allows users to examine data, design, generate, and embed charts. As an HTML version of Ranet OLAP may be used in any browser, the charts and dynamic analytics can be presented on all websites and applications as a result of the viewer. Because the browser is used, selected views can be saved and shared. CubesViewer’s Ranet OLAP integration allows even non-professional users to view data from numerous dimensions and aggregations, create complex queries, and generate sophisticated reports.

 The viewer makes it easy to exploit raw information, data series, and visualizations. The embedded viewer in our system will not require any additional installation or storage space.

What is OLTP?

OLAP OLTP shceme

Online transactional processing (OLTP) allows huge numbers of individuals to execute enormous numbers of database transactions in real time, generally over the Internet. Many of our everyday transactions, from ATMs to in-store sales to hotel reservations, are powered by OLTP systems. Non-financial transactions, such as password changes and text messages, can also be driven by OLTP.

OLTP systems employ a relational database that can perform the following functions:

  • Process a huge number of relatively basic operations, which are typically data insertions, updates, and removals.
  • Allow several users to access the same data while maintaining data integrity.
  • Allow for extremely fast processing, with reaction times measured in milliseconds.
  • Make indexed data sets available for quick searching, retrieval, and querying.
  • Be available 24 hours a day, seven days a week, with continuous incremental backups.

OLTP system requirements

A three-tier design is the most popular for an OLTP system that uses transactional data. It typically consists of a presentation layer, a business logic tier, and a data store tier. The presentation layer is the front end, when the transaction is initiated by a human or is generated by the system. The logic tier is made up of rules that check the transaction and guarantee that all of the data needed to complete it is available. The transaction and all associated data are stored in the data storage tier.

The following are the primary characteristics of an online transaction processing system:

  • ACID compliance requires OLTP systems to ensure that the complete transaction is appropriately logged. A transaction is often the execution of a program, which may necessitate the execution of numerous steps or actions. It may be considered complete when all parties involved recognize the transaction, when the product/service is delivered, or when a certain amount of updates to specific tables in the database are completed. A transaction is only properly recorded if all of the processes required are completed and recorded. If any of the steps contains an error, the entire transaction must be aborted and all steps must be deleted from the system. To ensure the accuracy of the data in the system, OLTP systems must adhere to atomic, consistent, isolated, and durable (ACID) qualities.


  • Atomic controls ensure that all steps in a transaction are executed successfully as a group. That is, if any of the stages between the transactions fails, all subsequent steps must also fail or be reverted. Commit refers to the successful completion of a transaction. The failure of a transaction is referred to as abort.


  • Consistent: The transaction preserves the database’s internal consistency. If you run the transaction on a previously consistent database, the database will be consistent again when the transaction is finished.


  • Isolated: The transaction runs as if it were the only transaction running. That is, running a series of transactions has the same effect as doing them one at a time. This is known as serializability, and it is often accomplished by locking certain rows in the table.


  • Concurrency: OLTP systems can support massive user populations, with multiple users attempting to access the same data at the same time. The system must ensure that all users attempting to read or write into the system can do so at the same time. Concurrency controls ensure that two users accessing the same data in the database system at the same time cannot change that data, or that one user must wait until the other user has completed processing before changing that data.


  • Scalability: OLTP systems must be able to immediately scale up and down to manage transaction traffic in real time and execute transactions concurrently, regardless of the number of users attempting to access the system.


  • Availability: An OLTP system must be available and ready to take transactions at all times. A transaction loss might result in income loss or have legal ramifications. Because transactions can be conducted from anywhere in the world and at any time, the system must be operational 24 hours a day, seven days a week.


  • High throughput and low response time: OLTP systems demand millisecond or even faster response times to keep enterprise users busy and match customers’ escalating expectations.

The primary distinction between OLAP and OLTP is: Type of processing

OLTP OLAP distinction

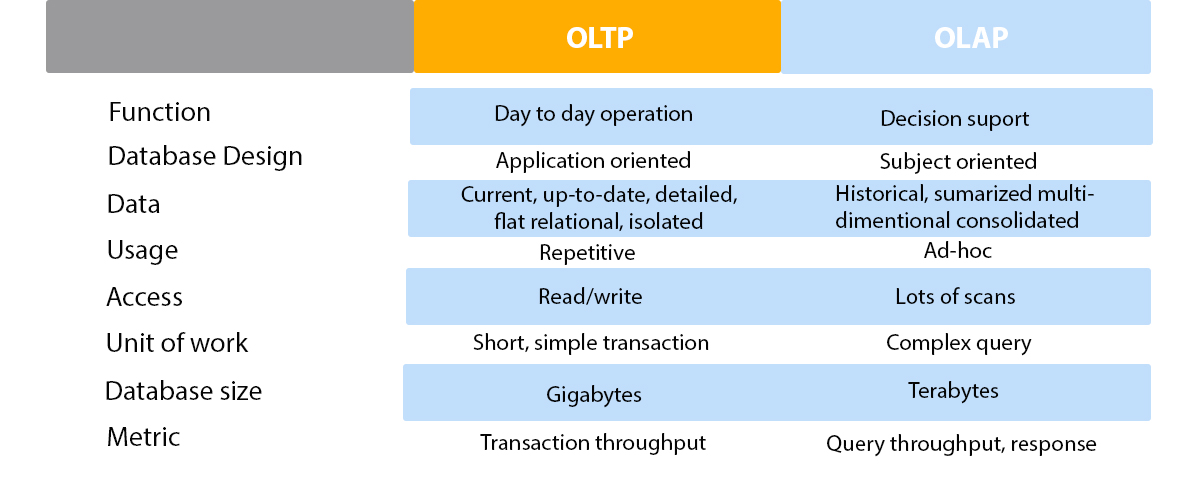
The major difference between the two systems can be found in their names: analytical vs. transactional. Each system is designed specifically for that type of processing.

OLAP is designed to perform complicated data analysis for better decision-making. Data scientists, business analysts, and knowledge workers use OLAP systems to support business intelligence (BI), data mining, and other decision support applications.

OLTP, on the other hand, is designed to handle a large number of transactions. Frontline workers (e.g., cashiers, bank tellers, hotel desk clerks) or customer self-service applications use OLTP systems (e.g., online banking, e-commerce, travel reservations).

Other key differences between OLAP and OLTP

  • OLAP systems enable data extraction for complicated analysis. The queries used to make business decisions frequently entail a huge number of records. OLTP systems, on the other hand, are perfect for doing simple database updates, insertions, and deletions. Typically, the inquiries involve only one or a few records.
  • Data source: Because an OLAP database is multidimensional, it can support complex queries of multiple data facts from current and historical data. Different OLTP databases can be used to aggregate data for OLAP and can be organized as a data warehouse. OLTP, on the other hand, makes use of a traditional DBMS to handle a high volume of real-time transactions.
  • Processing time: Response times in OLAP are orders of magnitude slower than in OLTP. Workloads are read-intensive and involve massive data sets. Every millisecond counts in OLTP transactions and responses. Workloads consist of basic read and write operations via SQL (structured query language), which need less time and storage space.
  • Availability: Because OLAP systems do not modify current data, they can be backed up less frequently. However, because of the nature of transactional processing, OLTP systems modify data frequently. They necessitate frequent or concurrent backups to ensure data integrity.

OLAP vs. OLTP: Which is the best option for you?

The best system for your situation is determined by your goals. Do you require a centralized platform for business insights? OLAP can assist you in extracting value from massive amounts of data. Do you need to keep track of daily transactions? OLTP is meant to handle huge numbers of transactions per second quickly.

It should be noted that typical OLAP systems necessitate data-modeling knowledge and frequently necessitate collaboration across different business units. OLTP systems, on the other hand, are mission-critical, with any outage resulting in disrupted transactions, lost revenue, and brand reputation damage.

Organizations frequently employ both OLAP and OLTP systems. In reality, OLAP systems can be used to evaluate data that leads to improvements in business processes in OLTP systems.

Analytical Maturity Model as a Key to Business Growth

Analytical Maturity Model as a Key to Business Growth

Analytics Maturity Model

Data Analytics Maturity Model

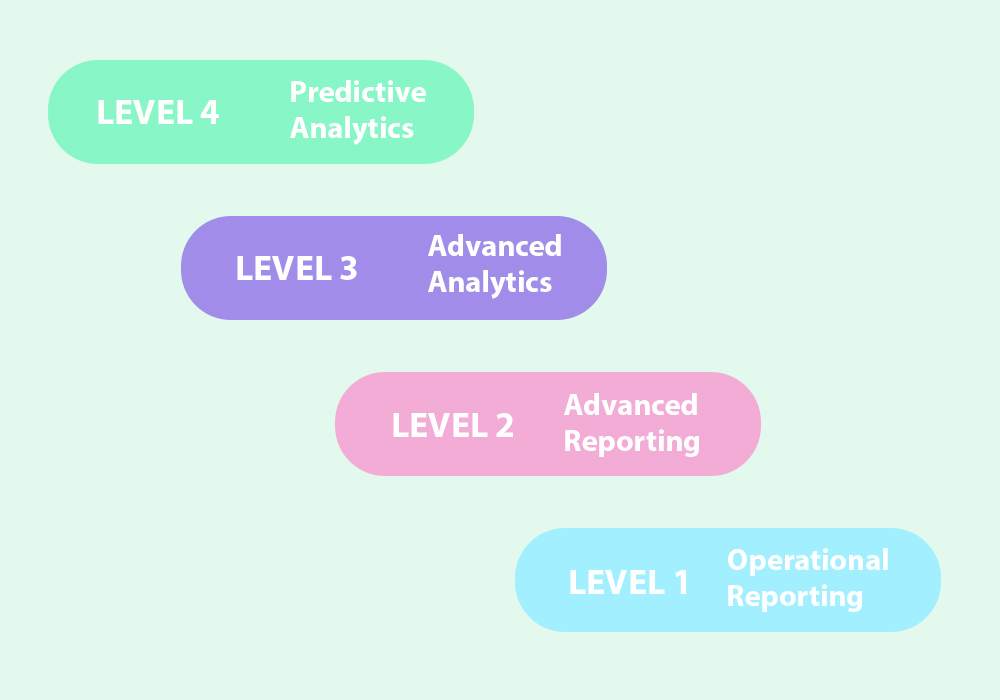
Analytics maturity is a model that describes how companies, groups, or individuals progressed through various stages of data analysis over time. This model progresses from simple to more difficult types of analysis, with the working assumption that the more complex types of analytics provide more value.

In this article, we will provide an overview of the widely used analytics maturity model’s purpose and discuss how it is frequently misinterpreted. By the end of this article, you will have a more nuanced understanding of how to apply the analytics maturity model within your organization.

What is Analytics Maturity?

On the surface, the analytics maturity curve appears to be simply the progression of types of analysis on which an organization focuses its resources. A single descriptive analysis use case, for example, is not as valuable as a single predictive analytics use case. Knowing what happened is useful, but not as useful as predicting the future. This is how analytics maturity progresses. Each level is directly related to the types of questions we’re attempting to answer.

In an organization, answering the question “What happened yesterday?” is much easier than answering the question “What will happen tomorrow?”

This is a straightforward example of analytics maturity. In general, the more effectively an organization invests in technology, processes, and people, the more complex questions it can answer. The underlying assumption is that the answers to these more complex questions are more valuable to an organization.

The types of questions are labeled with the types of analytics:

Descriptive = What happened?

Diagnostic = Why did it happen?

Predictive = What is likely to happen?

Prescriptive = How can we make something happen?

Analytics Maturity Levels

Analyzing Analytics Maturity Models

You’ve probably seen a version of the chart above if you work in data science, analytics, business intelligence, or even IT. It is so common that it has almost become cliche. Companies like Gartner have made a business out of creating cool little visuals like these, and you can find them all over the internet. It is an excellent way to differentiate between the various types of analysis. It is an excellent chart for visually demonstrating the various types of analysis.
People and businesses, however, misinterpret this visualization. They believe this is a road map. The transition from one type of analysis to another. This should not be the main point. In fact, having that as your final interpretation can be detrimental to your business.
Because of this misunderstanding, enterprises tend to overinvest in Predictive and Prescriptive analytics while underinvesting in Descriptive and Diagnostic analysis. That isn’t to say that Prescriptive analysis isn’t the “holy grail” of business intelligence; it is and will likely remain so; rather, focusing on Prescriptive analysis should not come at the expense of more foundational analysis.

Where Do People Go Wrong When It Comes to Analytics Maturity?

The main reason people misinterpret this chart is that they believe you are progressing from one type of analysis to another, from descriptive to diagnostic to predictive to prescriptive. Actually, this is not the case. You are not switching from one to the other; rather, you are expanding your organization’s analysis types.

As an example, consider a basic sales use case.

Descriptive: How much did we sell in July 2021?

Diagnostic: Why were our sales higher or lower in July 2021 compared to July 2020?

Predictive: What are our sales projections for July 2022?

Prescriptive: What should we do to ensure that sales in July 2022 exceed those in July 2021?

You should begin with descriptive questions and work your way up from there. Undoubtedly, the prescriptive question is a much more valuable one to answer, but the descriptive question is necessary to get there.

Analysis: Some businesses overinvest in Predictive/Prescriptive analytics (and the associated resources and tools) at the expense of Descriptive/Diagnostic analytics (and the corresponding resources and tools). Avoid falling into this trap. Descriptive use cases will always exist and serve as the foundation for more valuable analyses such as diagnostic, predictive, and prescriptive analytics.

What is It if Not Progression?

How can we characterize it if it isn’t a progression? It’s all about laying the groundwork.

Diagnostic analytics is built on descriptive analytics. Predictive analytics, for example, is built on diagnostic data. A firm foundation, just like a house, is required to support all of the other elements.
Three things should be kept in mind:


  • Just because a single descriptive use case is (usually) less valuable than a single prescriptive use case does not mean it isn’t beneficial overall.
  • There will always be more descriptive use cases than prescriptive use cases. As you proceed along the curve, the volume at each step decreases.
  • Prerequisite use cases at the other levels are also required for prescriptive use cases: predictive, diagnostic, and descriptive. Your company will never cease using these.

Ground Level of Analytics

It may be difficult to imagine, but there are still firms that do not use technology and conduct their operations with pen and paper. Even at this fundamental level, though, data is collected and controlled – at least for financial purposes.
There is no analytical strategy or organization at this point. Data is gathered to provide a better knowledge of reality, and in most situations, the only reports available are those that show financial performance. In many cases, no technology is used in data analysis. Reports are created in response to management’s ad hoc requests. However, most decisions are made based on intuition, experience, politics, market trends, or tradition.

The major issue here is a lack of vision and comprehension of the benefits of analytics. In many circumstances, there is also a lack of desire to invest time and resources in building analytical talents, owing to a lack of expertise. Changing management’s perspective and attitude would be an excellent place to start on the path to analytics maturity.

Descriptive Analytics

Most firms now employ software to collect historical and statistical data and display it in a more intelligible way; decision-makers then attempt to analyze this data on their own.

Keep Creator Personas in Mind

The architecture of your firm must accommodate multiple groups, each of which may have distinct personas.

The type of analytics that an individual (i.e. persona) focuses on is determined by their function and department within an organization. Invest in tools that will help you support both of these personas.

Line-of- Business Analysts will typically concentrate on Descriptive and Diagnostic use cases. They will typically work on a greater number of use cases (i.e. questions to answer). Despite the fact that each individual answer may not be as beneficial to the organization as a whole, the entire sum of the value supplied is quite significant owing to the volume.
Citizen Data Scientists and Analytics Engineers are typically supportive of prescriptive and predictive use cases. They often have a lower volume of use cases and answer a smaller set of questions, but the value of each of these responses can be higher.

Because each of these personas has a different focus, it is critical to choose the correct tool for that persona inside your organization.
A line-of-business analyst, for example, is probably best suited to Power BI and Tableau. Whereas Alteryx or Dataiku may be better suitable for a citizen data scientist or analytics engineers.

Let’s Take a Look at a Real-life application:

Data for Forecasting in a Variety of Areas

Machine learning and big data offer a wide range of analytical possibilities. ML algorithms are now used for marketing purposes, customer churn prediction for subscription-based businesses, product development and predictive maintenance in manufacturing, fraud detection in financial institutions, occupancy and demand prediction in travel and hospitality, forecasting disease spikes in healthcare, and many other applications. They’re even utilized in professional sports to forecast who will win the championship or who will be the next season’s superstar.

Automated Decisions Streamlining Operations

Apart from the obvious and well-known applications in marketing for targeted advertising, improved loyalty programs, highly personalized recommendations, and overall marketing strategy, the advantages of prescriptive analytics are widely applied in other industries. Automated decision support assists in the financial industry with credit risk management, the oil and gas industry with identifying best drilling locations and optimizing equipment usage, warehousing with inventory level management, logistics with route planning, travel with dynamic pricing, healthcare with hospital management, and so on.

Prescriptive analytics technologies can now address global social issues such as climate change, disease prevention, and wildlife conservation.

When you think of examples of prescriptive analytics, you might think of companies like Amazon and Netflix, which have customer-facing analytics and sophisticated recommendation engines. Other examples of how advanced technologies and decision automation may help firms include Ernsting’s family managing price, an Australian brewery organizing distribution, and Globus CR optimizing marketing strategy.

Important Challenges

The biggest obstacles a firm has at this level are not related to additional development, but rather to maintaining and optimizing their analytics infrastructure. According to studies, the primary issues with big data include data privacy, a lack of knowledge and professionals, data security, and so on. As a result, organizations should prioritize increasing their skills in data science and engineering, preserving customers private data, and maintaining the protection of their intellectual property at this time.

Conclusion

Don’t fall into the frequent pitfall of focusing solely on the gleaming predictive and prescriptive use cases. They are extremely valuable and should be invested in, but not at the expense of resources that support more fundamental analysis. Keep in mind that these “lower stages” of analysis are requirements for more complex projects.

Python *args and**kwargs. Could You Realize a Superior Way of Defining Your Functions?

Python *args and**kwargs. Could You Realize a Superior Way of Defining Your Functions?

Python Args Kwargs

How to use *args and **kwargs in Python

In Python, you define a function to make a code that performs this operation. To do this, you need to call a function with a value, which is called a function argument in Python.

We define a function that takes 2 arguments. It is a function for the addition of 2 numbers.

 Example of the function to add 2 numbers:

def add(x1,x2): 
    print("sum:", x1+x2)
 
add(14,16) 
 
#Output:
#sum: 30

As you can see in this program add() function needs to take 2 arguments x1 and x2. We get a sum of two numbers as a result when we pass two values while calling the function. But if we need to get a sum of 4 numbers. Let’s see what happens when we pass 4 numbers instead of 2 in the add() function. 

def add(x1,x2): 
print("sum:",x1+x2) 

add(9,11,13,15)

When we run the above program, we get output like these:

#Output:
#TypeError: add() takes 2 positional arguments but 4 were given

In conclusion, we can say that you can’t pass more arguments in a function, because it has a limited quantity of arguments. But what if you need to sum up a different number of arguments? It would be good if we can create a function, where the number of arguments passed is only determined at runtime. 

Here come *args and **kwargs. Args and kwargs in Python allow you to pass a variable number of arguments to a function. For, this you only need to use them as arguments in a function. At first, you need to understand the difference between *args and **kwargs. *args in Python are non keyword arguments and **kwargs mean keyword arguments in Python.

Keyword and non-keyword arguments

Let’s start from the basics. Arguments to built-in functions (or methods) can be passed by keyword parameter in Python, and the language has the ability to collect both positional and/or keyword arguments in a single call.

Positional or, in our case, non-keyword arguments are moved into the function by the order in which the parameters were recorded during the interpretation of the function. Therefore, it means that the order of arguments and parameters in Python is strongly important as the values passed to these functions are assigned to the analogous parameters based on their position. Actually, they are matched from left to right.

Example of using non-keyword arguments:

def example(name, date):
print(name + "`s birthday is on", date)

example("David", "12/01/2001")

#Output:
#David`s birthday is on 12/01/2001

Here are name and date are the arguments that are strongly located in the order 1.name 2.date. So when we use the function we need to type it in the same form.

Keyword arguments (or named arguments) are values that, when preceded by a function, are identified by specific parameter names. The key argument is passed by a parameter and the operator = that assigns it. Keyword arguments can be compared to dictionaries in that they map a value to a keyword. Therefore, the order in which these arguments are passed to the caller does not matter, as they correspond to the argument name.

def example(name, date):
print(name + "`s birthday is on", date)

example(date = "12/01/2001", name = "David")

#Output:
#David`s birthday is in 12/01/2001

And as mentioned already, the order that we provide keyword arguments doesn’t really matter: here name and date are not located in the same order as defined in the function. We used the name of an argument and made it equal to the content needed for it.

Take note that we can even make a function where non-keyword arguments are with keyword arguments, but take note again that if you provide a keyword argument before non-keyword, you can get SyntaxError

Let’s see two examples:

def example(name, date, location):
print(name, "is making birthday on", date, "in the", location)

example("David", location = "school", date="12/01/2001")

#Output:
#David is making birthday on 12/01/2001 in the school

We used different types of arguments. Here the argument ‘name’ became a positional argument and ‘location’ and ‘date’ – keyword argument. The next example will have a mistake:

def example(name, date, location):
print(name, "is making birthday on", date, "in the", location)

example(location = "school", "David", date="12/01/2001")

#Output:
#SyntaxError: positional argument follows keyword argument

And the mistake is that we have put the positional argument after the keyword argument. Again ‘name’ is the non-keyword argument and the other two are keyword arguments.

Python *args

In the example above the number of arguments is established, so we can not decide ourselves how many arguments to pass. Python arg can help us in this situation by passing the variable number of non keyword arguments to function. In the parentheses we need to use an asterisk * before the name of the keyword parameter Python to pass a variable quantity of arguments. Arguments are passed as a tuple, and those passed arguments create a tuple in a function with the same name as the parameter, excluding *.

Python argument passing example:

def multiply(x): 
print(x*x)

multiply(13)

#Output:
#169

And the example using *arg Python:

def example(*args): 
print(args)

example(13, 14, 16)

#Output:
#(13, 14, 16)

So actually we can improve our function to sum 4 numbers, 2 or another one you want. Take note that name *args here is just the name and we can use another one that we prefer.

 Example of using *args Python named as *numbers:

def add(*numbers):
sum = 0

for n in numbers:
sum = sum + n

print("sum:",sum)

add(13,14)
add(13,15,17,19)

#Output:
#sum: 27
#sum: 64

Here we used *numbers as a parameter so we are allowed to pass a variable quantity of argument lists to add() function. As you can see, we have created a loop that adds the passed argument inside the function and prints the result. *numbers takes all parameters that we have provided in the input and then packs them into a single iterable object named args. So we have passed 2 different tuples with variable lengths.

Using the Python args Variable in definitions of the Functions

Undoubtedly, there can be a lot of ways to pass varying lengths of arguments to the function. But using argss is one of the simplest. We can simply pass the whole list or a set of all arguments to our function. Here is an example of a harder way how to do it:

def sumOfElements(numbers_list):
example_list = 0

for n in numbers_list:
example_list += n
return example_list

list_of_numbers = [14, 15.5, 145]
print("sum of elements:", sumOfElements(list_of_numbers))
#Output:
#sum of elements: 174.5

So here we created the list and passed it into the function. This way can be useful when we already know what integers we want to use. But what to do when we want to implement elements into the function and we do not know what they are? Here is where our *args comes into our function.

 Args python example we have already seen before:

def sumOfElements(*numbers):
example_list = 0

for n in numbers:
example_list += n

print("sum of elements:",example_list)

sumOfElements(14, 15.5, 145)

#Output:
#sum of elements: 174.5

And here we see that all elements are added after the function. So it is more easier and more convenient for us to use *args in the function.

Also, we can make the opposite usage of asterisk operators, where the asterisk symbol will not be used when we define the function, but when we call it:

def personal_name(first, second, third):
print("Name:", first)
print("Middle name:", second)
print("Surname:", third)

args = ("John", "Fitzgerald", "Kennedy")
personal_name(*args)

#Output:
# Name: John
# Middle name: Fitzgerald
# Surname: Kennedy

def personal_name(first, second, third):
print("Name:", first)
print("Middle name:", second)
print("Surname:", third)

args = ("John", "Fitzgerald", "Kennedy")
personal_name(*args)

#Output:
# Name: John
# Middle name: Fitzgerald
# Surname: Kennedy

Here we created three parameters: first, second, and third. We created a variable args that will be our tuple. Asterisk syntax helped us to pass the variable into the function. 

Also, we can combine already-named parameters with the arg in Python. Here is an example:

Python kwargs tutorial

**kwargs are useful for passing a variable length of arguments to a Python function. In the parentheses we use two asterisks ** before the name of the parameter to denote the type of argument. Python keyword arguments are passed as a dictionary, as we know now *args are passed as a tuple, and those passed arguments create the dictionary in the function with the same name as the parameter, excluding **. Similar to *args example, let’s try to make an example of **kwargs:

def example(**kwargs): 
print(kwargs)

example(13, 14, 16)

#Output:
#TypeError: example() takes 0 positional arguments but 3 were given

And we have got a TypeError. The next example of using kwargs Python will explain why it happened:

def example(**kwargs): 
print(kwargs)

example(first = 13, second = 14, third = 16)

#Output:
#{'first': 13, 'second': 14, 'third': 16}

Here we can see, that the main difference between *args and **kwargs is the difference of the types. When using *args we create a tuple, **kwargs only receive dictionaries. Don’t forget that name don’t need to be **kwargs again. It can be another one that we prefer, but be careful with asterisks!

def example(**kwargs):
for first, second in kwargs.items():
print("{0} is {1}".format(first, second))

example(Name="Kevin")

#Output:
#Name is Kevin

Here we used the .format() string method to specify values and insert them inside the string’s placeholder. kwarg helps us to work with the Name variable, so we can take the content from it and push it in the curly brackets of the .format(first, second).

Using the Python kwargs Variable in definitions of Functions

So now we have understood what are **kwargs. They work same as *args but instead of non-keyword arguments it accepts keyword ones. Let’s make an example so we can see why **kwargs are useful enough:

def example(**sentence):
example_list = ""
for n in sentence.values():
example_list += n
print(sentence)

example(a="Good ", b="morning, ", c="KoderShop", d="!")

#Output:
#{'a': 'Good ', 'b': 'morning, ', 'c': 'KoderShop', 'd': '!'}

Making some formatting we can make it more readable:

def example(**sentence):
example_list = ""
for n in sentence.values():
example_list += n
return example_list

print(example(a="Good ", b="morning, ", c="KoderShop", d="!"))

#Output:
#Good morning, KoderShop!

Here we used print features to make the code look more accurate and now we can actually see how good **kwargs is. Note that in the example above, the iterated object is a standart dict. If you are looping through a kwargs dictionary and want to return its values, as in the example above, you should use .values().

In another situation, if you want to take only keys in the dictionary, you need to remove .values(), like in the example below:

def example(**sentence):
example_list = ""
for n in sentence:
example_list += n
return example_list

print(example(a="Good ", b="morning, ", c="KoderShop", d="!"))

#Output:
#abcd

When can we use them?

It really depends on the requirements. The most common use case of args kwargs Python is to create function decorators. In addition, it can also be used to repair monkeys. Let’s say you have a class with a get_info function that calls an API and returns response data. If we want to test this, we can replace the API call with test data. Sounds difficult, but undoubtedly I think Python args kwargs can have a lot of ways to make them useful.

Function order of the arguments

When we create a function that takes a changeable number of both positional and named arguments, the order counts. Take a note, or learn by heart the set order when ordering args in a function and undoubtedly function call. The *args like non-default arguments have to precede the **kwargs that are like default arguments. Let’s see the correct order of parameters:

First – Standard arguments;

Second – *args;

And the last – **kwargs.


The next question is: what happens if we define a function with non-correct order of parameters? Here is an example:

def example(**sentence, *args, x):
print("Is it right?")

#Output:
#def example(**sentence, *args, x):
# ^
#SyntaxError: invalid syntax

Here we can see that **kwargs precedes *args in a function definition. If you try to run this example, you immediately get an error message from the interpreter and it does not matter what you have written next in the code.

The correct ones will look like that:

def example(*numbers, **keys):
words_list = ""
sum_of = 0
for n in numbers:
sum_of += n
for m in keys:
words_list += m + ' '
print('Sum of numbers:', sum_of, '\nWords from keys:', words_list)

example(1, 2, 12.5, Watch='first', how='second', I='third', can='fourth')

#Output:
#Sum of numbers: 15.5 
#Words from keys: Watch how I can

And here we used 2 arguments *args and **kwargs to complete our sum_of and words_list.

Unpacking operators in Python

We use *args and **kwargs to define Python functions that accept different numbers of input arguments. Let’s understand a bit more about these operators.

These single and double operators are in Python from the Python 2.

Single and double star unpacking operators were introduced in Python 2. As people say, they have become more powerful only in Python 3 thanks to PEP 448, which was created in June 2013.

This PEP offers extended use of the * iterative unpacking operator and the ** dictionary unpacking operators to allow us to use it in more positions under additional circumstances, such as function calls, in generator understandings and expressions, and in mappings. So what are these “unpacking operators”?

In short, unpacking operators are operators that unpack values ​​from iterated objects in Python. The single-star * operator can be used for any iterator that Python provides, while the double-star ** operator can only be used for dictionaries.

Unpacking lists

Let’s see some examples of lists:

example_list = ['Hello,', 'KoderShop', '!']
print(example_list)

#Output:
#['Hello,', 'KoderShop', '!']

Here we see how the standard output of the list works. We have square brackets, commas and our values. We do not want that. Now we gonna use unpacking operator *. What will the output be?

example_list = ['Hello,', 'KoderShop!']
print(*example_list)

#Output:
#Hello, KoderShop!

So here the asterisk operator talks with print and makes it unpack the list first. We do not have these annoying brackets and commas and can see only the content of the list. And also we have changed arguments so the content in the output will look more clear.

It is one explanation of what asterisks can do. They make print() in-built functions take these two separate arguments as the input.

Calling functions

This asterisk method we can use to call our functions. The only rule is that we should make the iterable we unpack to have the same number of arguments if we want our function to have a specific number of arguments.

def example(first, second, third):
print(first * second * third)

example_list = [1, 2, 3]
example(*example_list)

#Output:
#6

So we have here the *example_list which means that we have unpacked our list and used only content from it to make the multiplication we need. Try yourself, what will happen without the asterisk…

def example(first, second, third):
print(first * second * third)

example_list = [1, 2, 3]
example(example_list)

#Output:
#TypeError: example() missing 2 required positional arguments: 'second' and 'third'

Before the example of an error, we had 3 elements in our example_list that meet up the required arguments in example(). 

Example, where the function requires 5 arguments, but we make only 3:

def example(first, second, third):
print(first * second * third)

example_list = [1, 2, 3, 4, 5]
example(*example_list)

#Output:
#TypeError: example() takes 3 positional arguments but 5 were given

Here we see how the Python interpreter is unable to run it because example() expects 3 items, but the unpacking operator gets 5 items from our list. The next part of the code will not run.

Several unpacking operators

To unpack the list we use the * unpacking operator so we can pass arguments to a function. It means that we pass every single argument by itself. And again that means using multiple asterisk operators is possible and we get content from several lists. That is all we pass to a single function.

Here is one of the examples:

def sentence(*args):
temp = ''
for n in args:
temp += n
print(temp)

words1 = ['— Hello, ' 'how ', 'are ', 'you?\n']
words2 = ['― I ', 'am ', 'fine, ', 'thanks. ', 'And ', 'you?\n']
words3 = ['― Me ', 'too.']
sentence(*words1, *words2, *words3)

#Output:
# — Hello, how are you?
# ― I am fine, thanks. And you?
# ― Me too.

Running this example, we see that our lists of words were successfully unpacked. Every word was passed to the function sentence() so we can see the speech. In the end of every item, we have added the space so it could look like the normal sentence but not the array of symbols. Also we used the ‘\n’ newline character at the end of the last item in the list.

Split and merge using unpacking operators

Here is another way to use the unpacking operator. For instance, we have a list and our wish is to have it split into three parts, where the last value of the list will be at the end of the output, first value will be at the start, and another value will be between.

example_list = [1, 26, 3.3, 4, 5.3, 6]
first, *second, third = example_list

print(first)
print(second)
print(third)

#Output:
#1
#[26, 3.3, 4, 5.3]
#6

Here we see 6 items in the example_list. We create 3 variables. First(example_list[0]) must be at the start, *second at the middle, and third(example_list[5]) at the end. The new list *second is a created list of all other elements. In the output section we see how to print() shows us our three variables have the values we expected.


Also using unpacking operators * we can split items of iterable objects. For example, we decided to merge two lists, so it could be useful:

first = 1
second = [26, 3.3, 4, 5.3]
third = 6

example_list = [first,*second,third]
print(example_list)

#Output:
#[1, 26, 3.3, 4, 5.3, 6]

As it worked before it worked also here. *second took all the elements from the second list inside and added them into the example_list. Integers from the first and third were added using standard in-built syntax.


Asterisk operators can also even merge two different dictionaries. We need to use now double-asterisk operator **:

first = {'Ab':3, 'Cd':2}
second = {'Ef':1}

example_list = {**first,**second}
print(example_list)

#Output:
#{'Ab': 3, 'Cd': 2, 'Ef': 1}

So now we created three dictionaries, where the third one example_list is the merged list from two others. Firstly, we can see that now we use curly brackets, so we know that they are dictionaries, and also double-asterisk operators, to show that we are working with dictionaries.

 Another feature of unpacking operators is unpacking strings. Remember now that * operator is used on any iterable object. Let’s see some examples of string:

example = [*"KoderShop is the best!"]
print(example)

#Output:
#['K', 'o', 'd', 'e', 'r', 'S', 'h', 'o', 'p', ' ', 'i', 's', ' ', 't', 'h', 'e', ' ', 'b', 'e', 's', 't', '!']

Here we can see how * operator made the split of the symbols from the string. Strings are iterable in Python, so it’s why we got such a result after unpacking. 

Take a minute, and think how the next example differs from the example above.

Here we can see how * operator made the split of the symbols from the string. Strings are iterable in Python, so it’s why we got such a result after unpacking. 

Take a minute, and think how the next example differs from the example above.

*example, = ["KoderShop is the best!"]
print(example)

#Output:
#['KoderShop is the best!']

Yes, you are right. In one line we got the * operator then a variable and then a comma. We created a new list called example, which takes the “KoderShop is the best!”. The comma makes a thing. When we use the asterisk operator for assigning a new variable, Python requires that the result be a list or a tuple. With the following comma, we have already defined that we have a tuple with the name: example, and which letters are the same as in the example before that: [‘K’, ‘o’, ‘d’, ‘e’, ‘r’, ‘S’, ‘h’, ‘o’, ‘p’, ‘ ‘, ‘i’, ‘s’, ‘ ‘, ‘t’, ‘h’, ‘e’, ‘ ‘, ‘b’, ‘e’, ‘s’, ‘t’, ‘!’].

NET MAUI as a Universal Development Platform

NET MAUI as a Universal Development Platform

NET MAUI
NET MAUI Technology

NET MAUI – Let’s Explore What Is It

At the stage of software design, one of the main points is the environment in which the software product will work. It can be a mobile device, a tablet, or a computer running Windows, Linux, or Raspberry PI operating systems. And what if we need a universal environment where we can run our application without being tied to a device? The .NET MAUI platform comes to the aid of the developer. Let’s talk about this in more detail. The abbreviation MAUI stands for Multi-platform App UI. This system is used to develop user interfaces for both classic desktop applications and mobile devices.

Implemented the NET MAUI platform in the form of 2 types of projects:

  1. Based on Blazor technology.
  2. Based on XAML technology.

NET MAUI Characteristics

Despite the fact that the system is universal, it still has minimal system characteristics and does not support many outdated devices. Consider the minimum versions of operating systems:

  • Android minimum supported version is 5.0 (API 21) if using XAML and Android 6.0(API 23) if we use MAUI Blazor.
  • IOS – minimum supported version 10. If we use .NET MAUI Blazor – IOS 11 and above are required.
  • MacOS is the minimum version of 10.13. and mandatory use of MAC Catalyst.
  • Windows – Microsoft MAUI is available with version 1809 (Windows 10) and Windows 11 is supported.
  • Linux – at the moment it is known that there is support, but there are no minimum system requirements.

From this characteristic, we can notice that the Blazor variant is more demanding on operating systems. If we consider support for Linux systems, and this will work well, this opens up great opportunities for using the MAUI App on other devices, including TVs and projectors. MAUI developers get great development opportunities – code once – works everywhere.

Features of .NET MAUI Technology

A nice feature for MAUI developers is that this system supports hot reloading .NET. What does this mean? This is a feature that allows you to change the program code while the application is running without having to recompile and stop it. Everything happens in real time.

Also, for the convenience of developers, there is access to API and tools for a specific platform. This allows the use of sensors such as a compass, gyroscope, and accelerometer. It is also possible to receive complete information about the device – the level of connection with the Internet.

How the MAUI Architecture Works

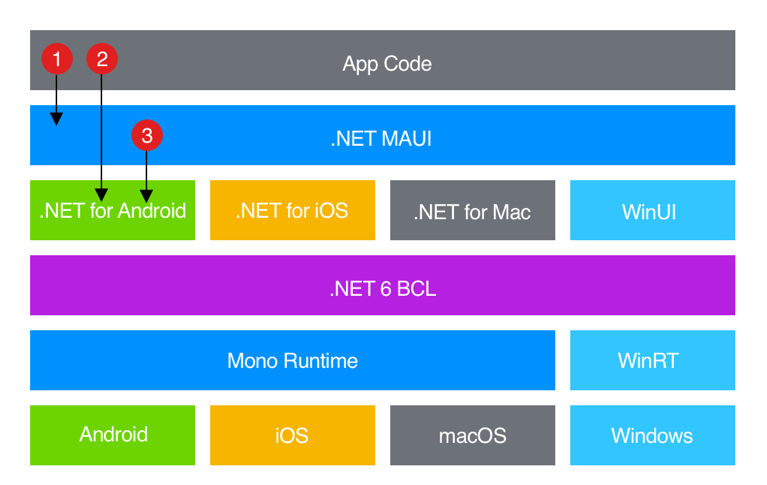
Consider the architecture of this technology based on the image provided by Microsoft:

NET MAUI technology

Consider the sequence of code execution.

When running the code, our code interacts directly with the MAUI API. Next MAUI uses its API to use the target platform interface, however, the application code can use the API of the target platform function directly.


Next, consider compiling for each operating system:

  • Android – Compilation is from C# to Intermediate Language (IL) then JIT compilation to native assembly.
  • IOS –  compilation happens immediately to ARM assembly code
  • macOS – compile as under IOS with subsequent changes using the Mac Catalyst program
  • Windows – uses the WinUI 3 library to create a ready-made windows maui apps

Comparison of NET MAUI with Other Technologies

At the moment, the main contender for comparison is Xamarin. For a more detailed comparison, consider this technology.

Xamarin is an open-source technology that allows you to create high-performance applications on different architectures at a level of abstraction that allows you to provide control between the main code and the code of the underlying platform, being a link. Does it sound familiar? The question arises: why then should we use NET MAUI? This platform is an evolution of Xamarin Forms – no need to create different projects, 1 project for all operating systems. There is no need to change the logic moving away from the operating system, there is no dependency on the file system either.

Let’s Summarize

 In this article, we examined the main features of the new progressive technology by Microsoft – .NET MAUI. This technology makes it possible to significantly facilitate the development of software, at the moment when the project is simultaneously needed on different operating systems and devices: phones, computers, tablets, and even TVs.