In today's fast-paced business environment, success in sales isn't just about closing deals—it's about having a crystal-clear view of the numbers driving those deals. Odoo 18 brings an enhanced analytics system to the table, featuring comprehensive reports on key performance indicators, customizable dashboards, and scheduled email digests packed with KPIs. These tools provide unparalleled transparency, enabling teams to respond swiftly to market shifts and make data-driven decisions that propel growth.
Whether you're a sales manager juggling multiple team members or a business owner overseeing overall performance, understanding how to leverage these features can transform your approach to sales management. By integrating real-time insights with user-friendly visualizations, Odoo 18 ensures that every stakeholder, from entry-level reps to C-suite executives, stays aligned and informed. This not only boosts efficiency but also fosters a culture of accountability and continuous improvement within your organization.
Core Reports in the
Sales Module
When it comes to dissecting your sales operations, having access to reliable and detailed reports is fundamental. In Odoo 18, the Sales module serves as a powerhouse for analytics, offering a suite of built-in reports that illuminate various facets of your sales process. These reports are designed to help you uncover patterns, identify strengths, and pinpoint areas needing improvement, all while saving time on manual data crunching.
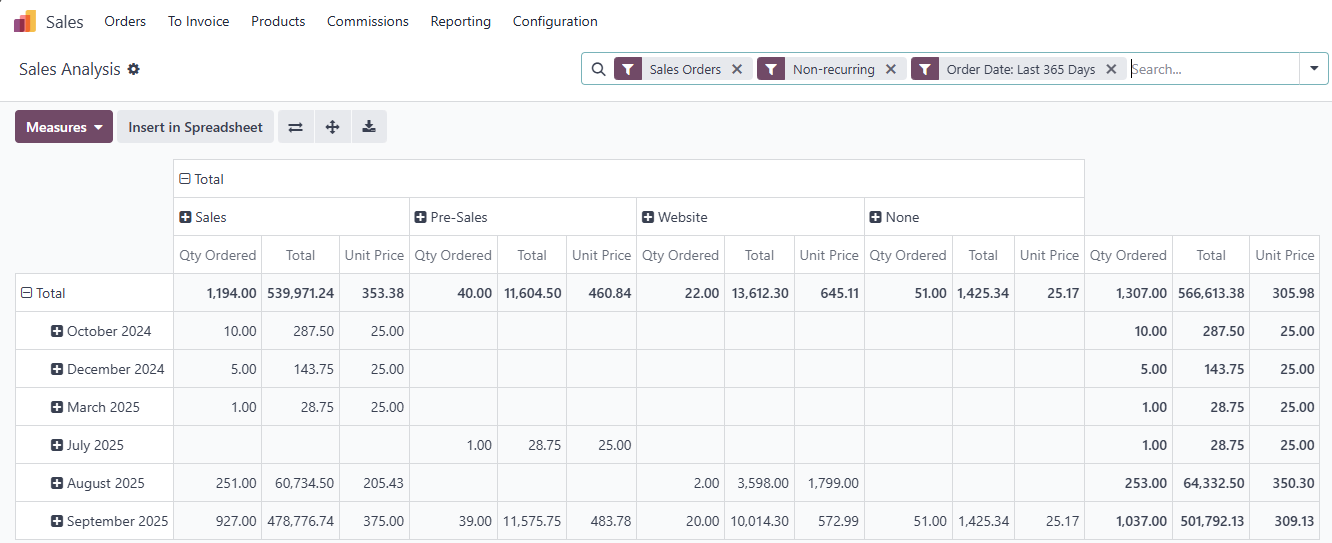
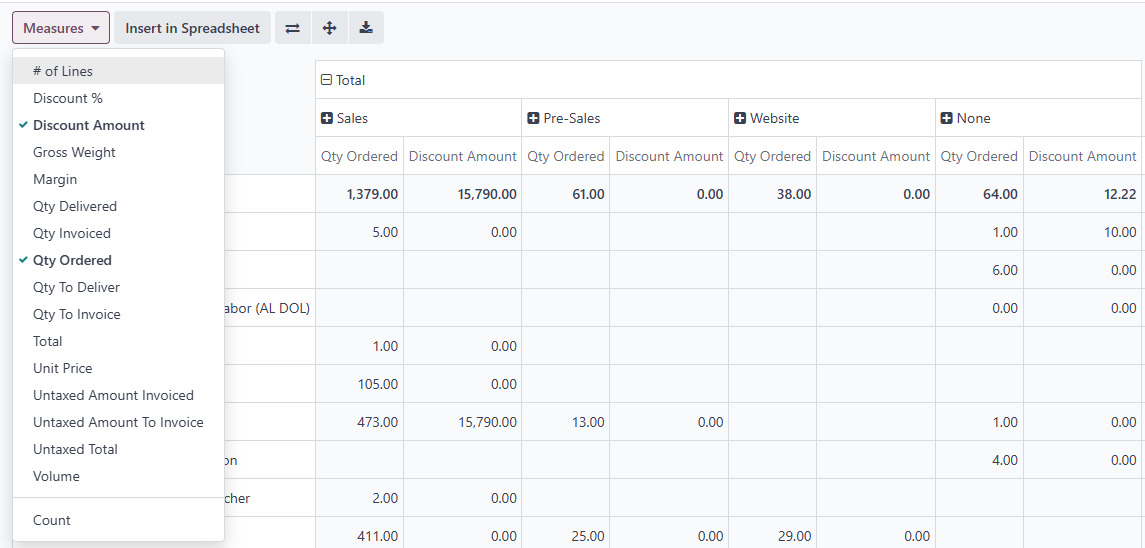
Navigating to the Sales menu and selecting Reporting unveils a variety of report types that cover the essential aspects of sales activities. For instance, the Sales report provides an overview of total sales volume, order amounts, and invoiced sums. This allows you to assess revenue across different periods and business segments, giving you a bird's-eye view of financial health.
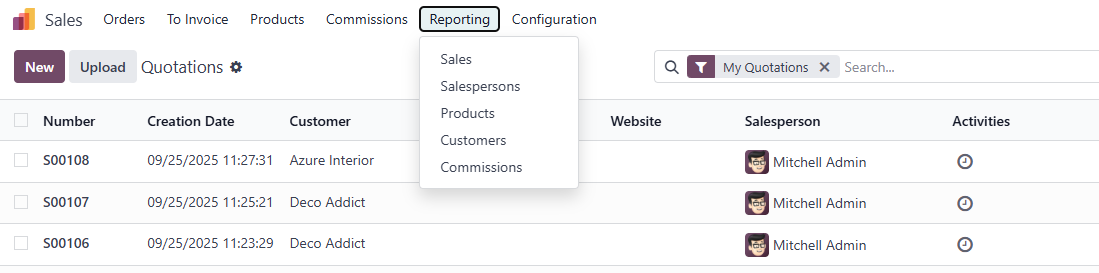
The Salespersons report dives deeper into individual performance, showcasing the efficiency of each sales manager through metrics like Qty Ordered, revenue generated, and average Unit Price value. This is invaluable for performance reviews and incentive planning, helping you reward top performers and coach those who might be lagging.
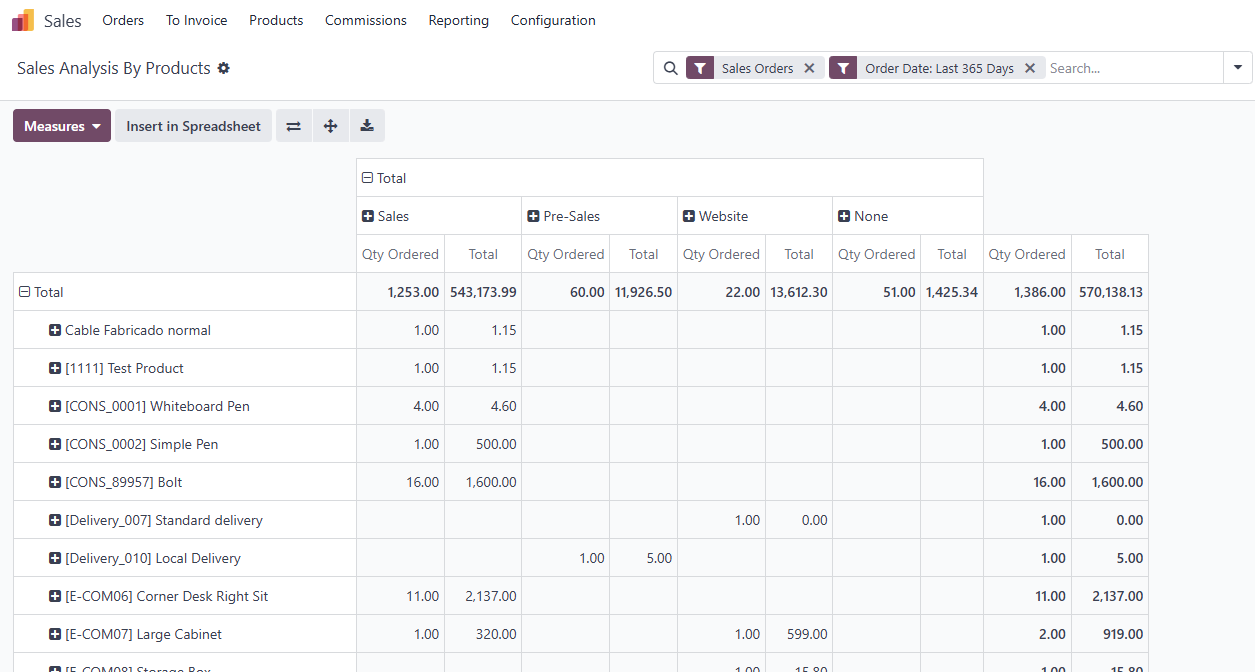
Products report focuses on inventory analysis, revealing which items generate the most profit, which move quickly off the shelves, and which linger longer than expected. By understanding product performance, you can optimize stock levels, refine pricing strategies, and even discontinue underperformers to streamline your offerings.
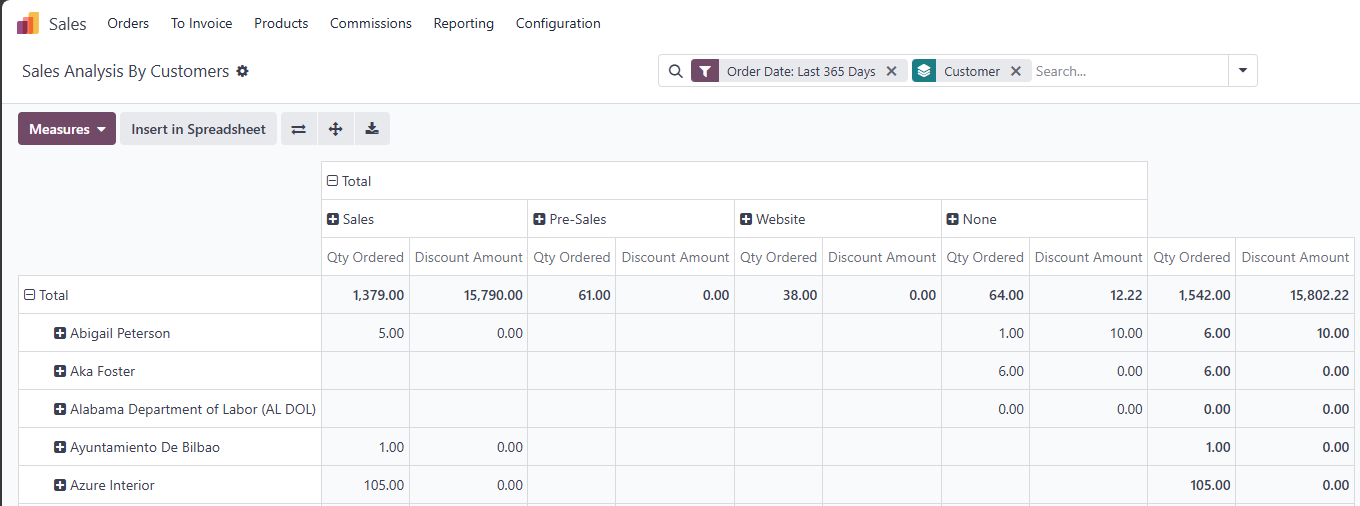
Lastly, the Customers report offers insights into client data, including total revenue per customer, trends in repeat orders, and loyalty indicators. This helps in nurturing long-term relationships and tailoring marketing efforts to high-value clients.
What makes these reports truly powerful is their flexibility. You can drill down using filters, groupings, and metric selections. For example, group data by months, product categories, or sales teams to reveal seasonal trends or team-specific efficiencies. This level of customization ensures that the information is not just available but also actionable, turning raw data into strategic advantages.
In practice, imagine a retail business using the Products report to spot that a particular gadget is flying off the shelves during holiday seasons. By filtering for quarterly data, they could adjust inventory procurement accordingly, avoiding stockouts and maximizing profits. Such granular analysis prevents guesswork and empowers informed decision-making.
Data Visualization: From Tables to Charts
Visualizing data effectively can make the difference between overwhelming spreadsheets and insightful revelations. In Odoo 18, the platform recognizes that not everyone processes numbers the same way, so it provides multiple presentation options to make information more digestible and engaging. This section explores how transforming raw data into visual formats can enhance comprehension and drive quicker responses to business challenges.
Odoo offers several visualization methods to suit different analytical needs. Charts, including line, bar, and pie varieties, allow for intuitive tracking of trends over time. A line chart might illustrate sales growth month-over-month, highlighting peaks and valleys that signal market opportunities or issues.
Pivot tables take things a step further, enabling detailed numerical computations and comparisons. These are perfect for cross-tabulating data, such as comparing sales by region and product category, to uncover hidden correlations.
Cohort analysis is another gem, helping you understand customer behavior over time, like retention rates for repeat purchases. This is crucial for subscription-based models or e-commerce, where knowing how cohorts evolve can inform retention strategies.
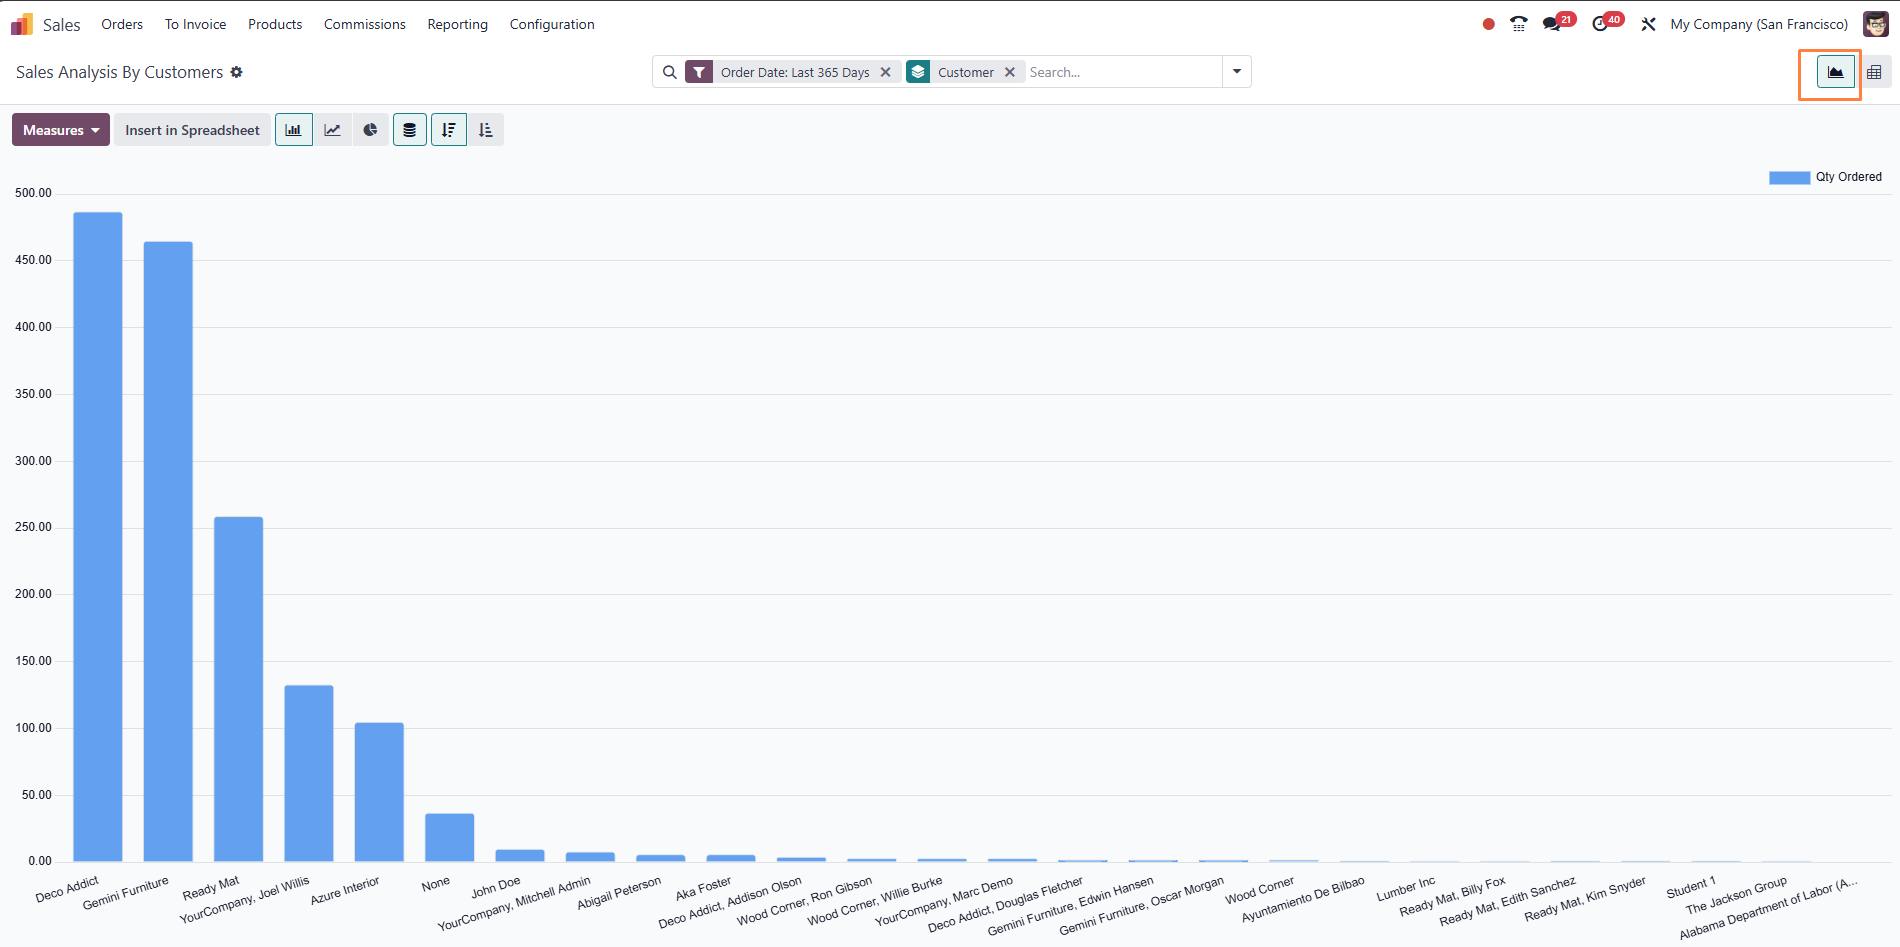
These tools empower leaders to grasp the big picture at a glance, while sales staff can monitor personal metrics without getting lost in complexity. For example, a sales team leader might use a bar chart to compare quarterly revenues across territories, quickly identifying underperforming areas and reallocating resources.
Moreover, the integration of these visualizations means you can switch views seamlessly within the same report. Starting with a pivot table for precise calculations and then pivoting to a chart for presentation purposes streamlines workflows. In a real-world scenario, a marketing coordinator could use cohort analysis to track how customers acquired through a specific campaign perform over six months, adjusting future campaigns based on those insights.
By making data visually appealing, Odoo 18 reduces the cognitive load on users, allowing them to focus on interpretation rather than extraction. This not only speeds up analysis but also encourages more frequent use of the system, embedding data-driven habits into daily operations.
Dashboard: Quick Access Panel to KPIs
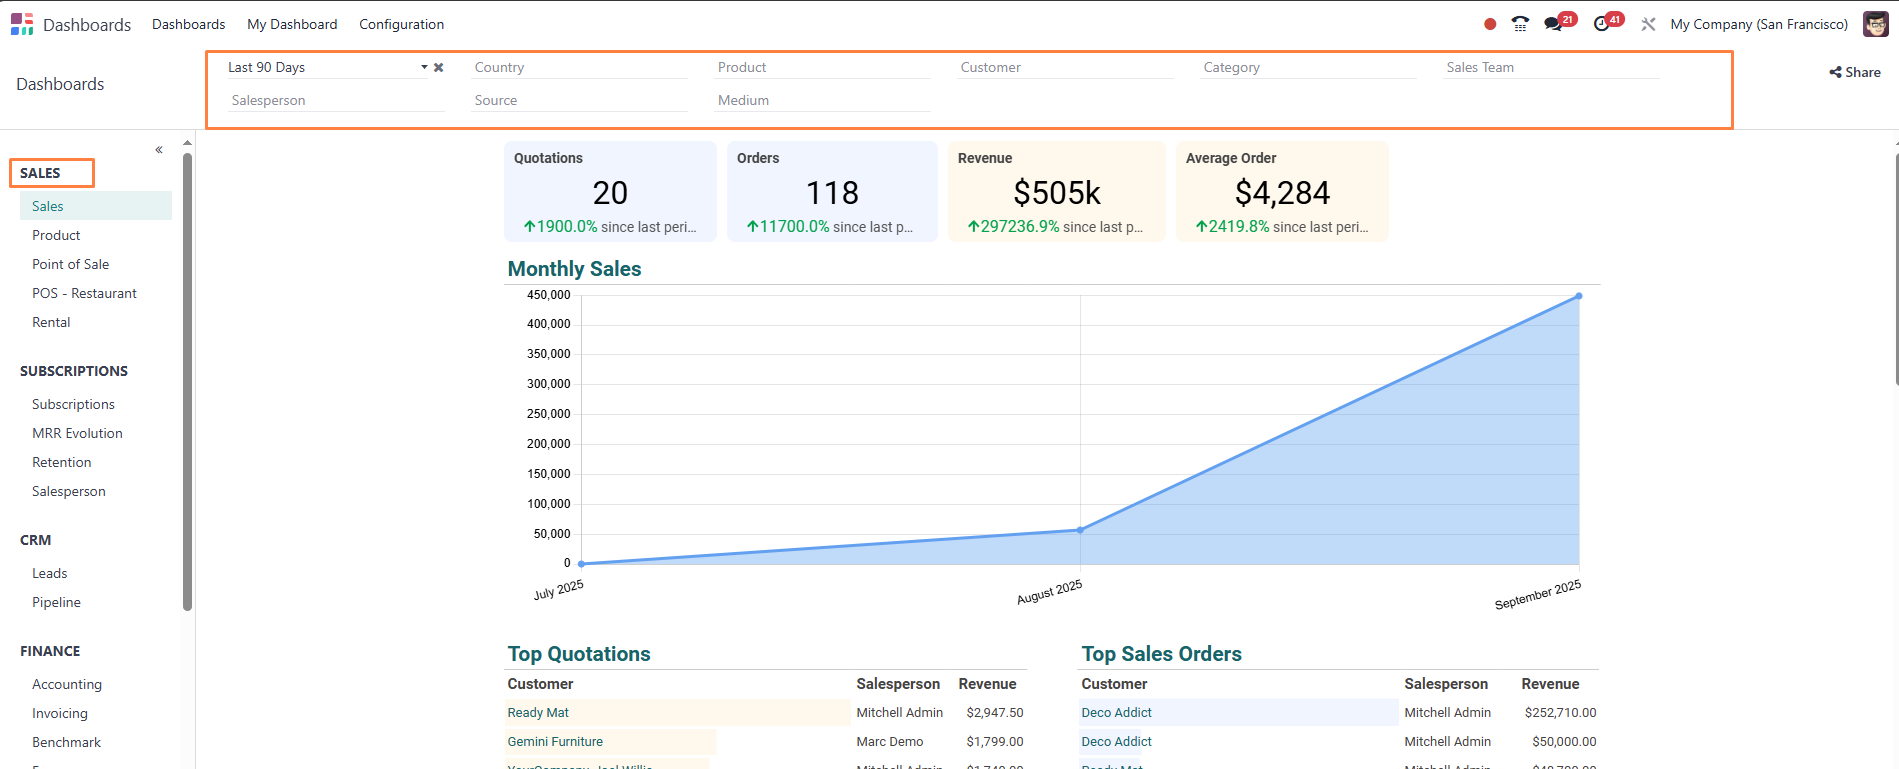
In the hustle of daily business, constantly switching between reports can be inefficient and frustrating. That's where dashboards come in as a centralized hub for monitoring key metrics. Odoo 18's Dashboard feature is engineered to provide at-a-glance insights, customizable to fit individual roles and responsibilities, ensuring that critical information is always front and center.
Users can personalize their dashboards by adding tiles and graphs that display the most relevant KPIs. Sales managers might include team-specific metrics like pipeline value or conversion rates, while company executives could focus on high-level business indicators such as overall revenue growth or market share.
Individual salespeople can set up views for their personal goals and achievements, like daily quotas or lead follow-ups. This turns the dashboard into a personal command center, fostering motivation and self-management.
Customization is straightforward: drag and drop elements, resize widgets, and choose from various display formats. For instance, a colorful gauge chart could show progress toward monthly targets, providing visual motivation.
In a growing enterprise, the CEO might configure a dashboard with real-time updates on global sales figures, while a regional manager focuses on local trends. This role-based approach ensures relevance and prevents information overload.
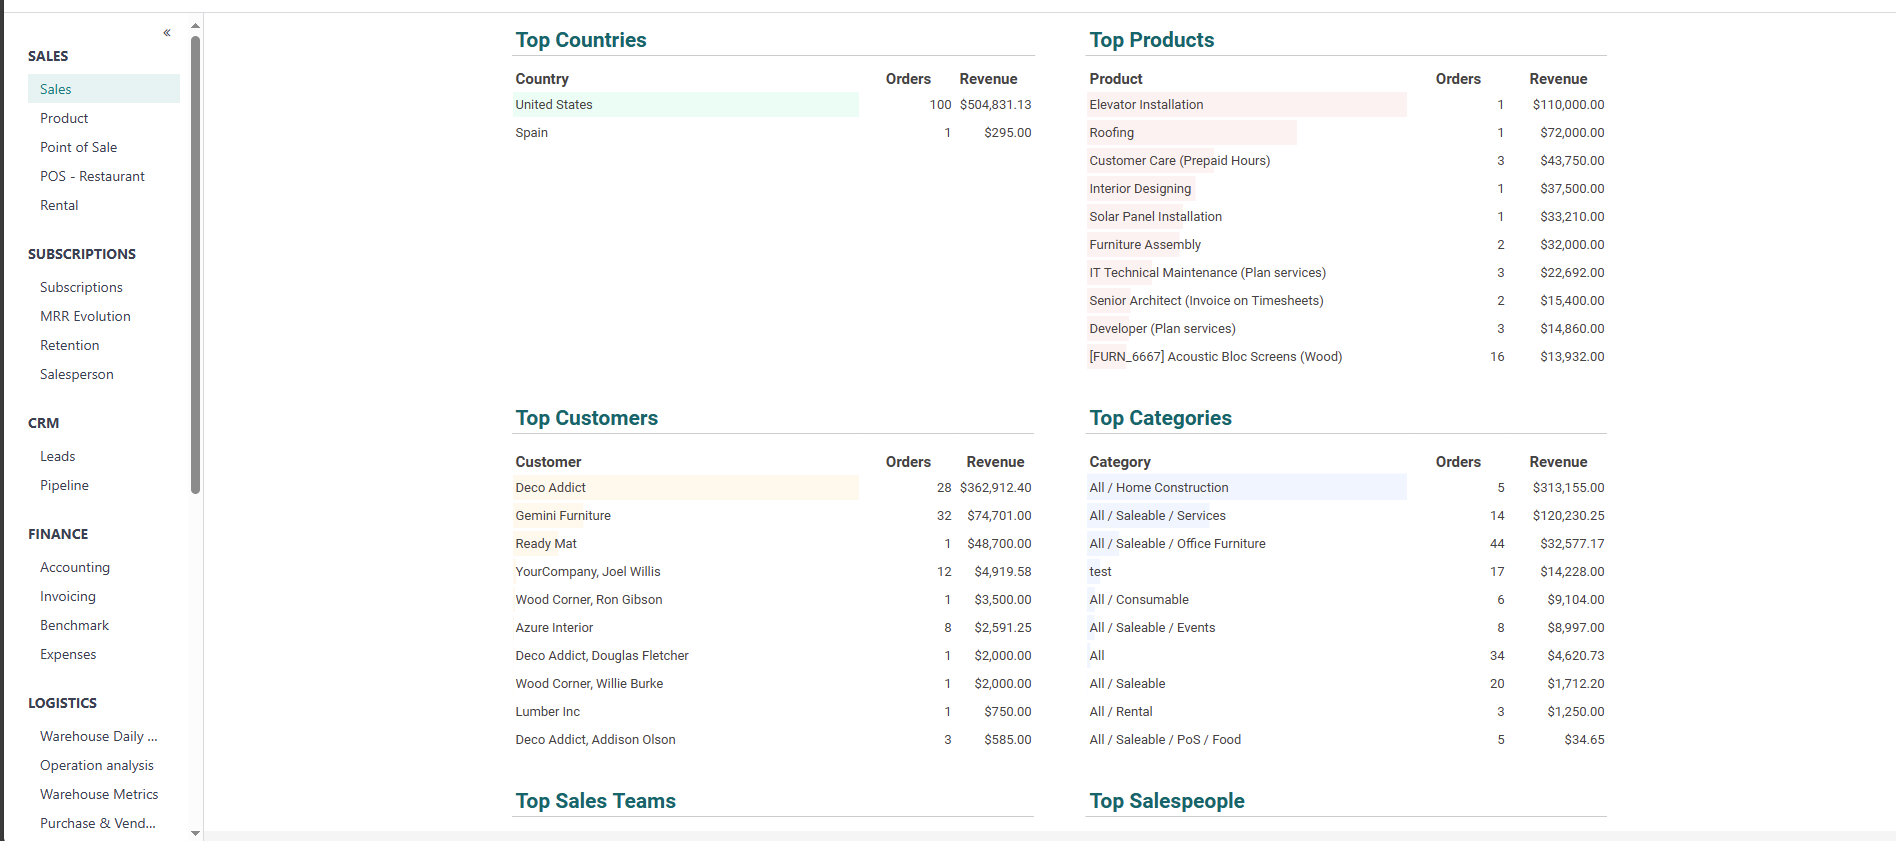
Furthermore, dashboards support integration with other Odoo modules, pulling in data from CRM or inventory for a holistic view. This interconnectedness means decisions are based on comprehensive data, reducing silos and enhancing collaboration across departments.
Automated KPI Digests
via Email
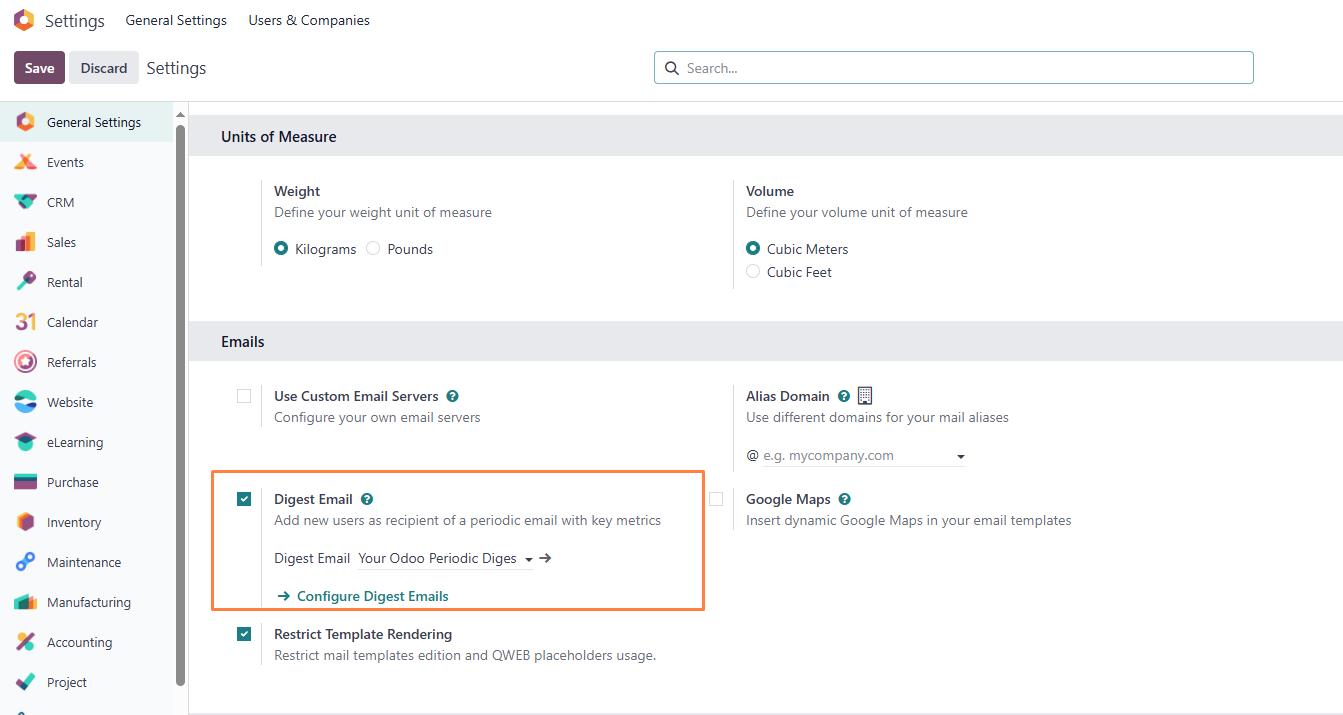
Staying on top of performance metrics shouldn't require constant logins to the system. Automated email digests in Odoo 18 address this by delivering key insights directly to your inbox, making it easier for busy professionals to stay informed without disrupting their workflow.
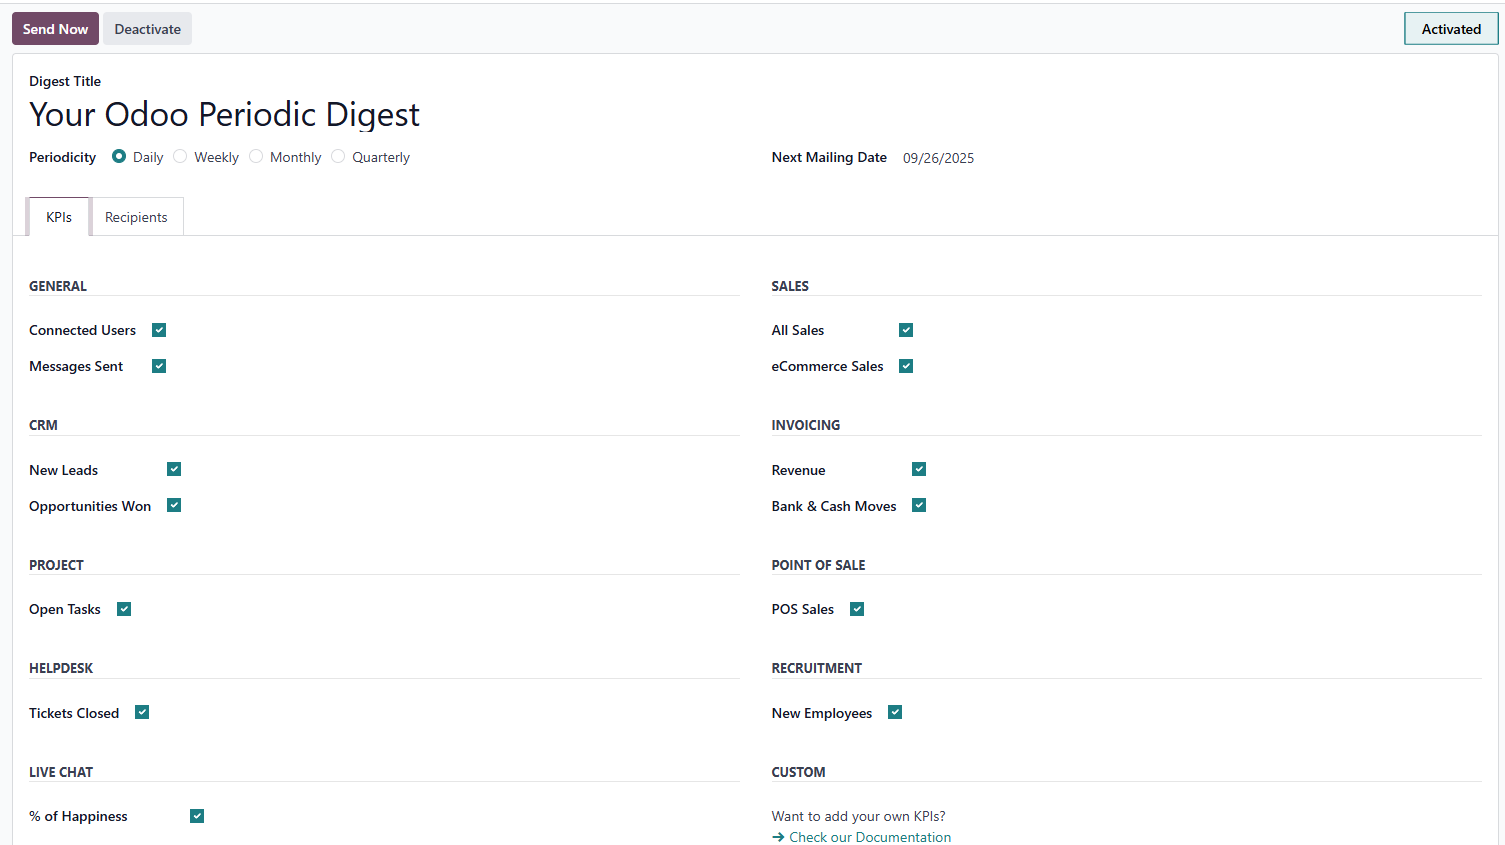
Setting up these digests is user-friendly through the Digest-email configurations. You specify the frequency—daily, weekly, or monthly—tailoring it to your needs. Then, select which KPIs to include, such as sales totals, new leads, or invoiced amounts.
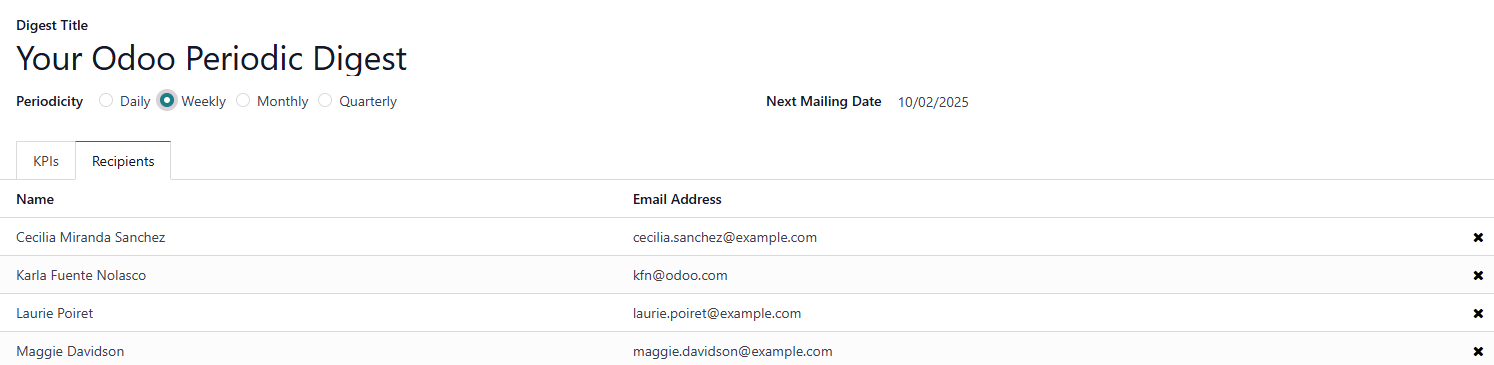
Recipients can be individualized or group-based, ensuring the right people get the right information. Additionally, Odoo Studio allows for custom KPIs if the defaults fall short, like industry-specific metrics.
For example, a sales manager might receive weekly updates on sales volume, won deals, and top clients, while the director gets monthly overviews of total revenue and regional dynamics. This automation keeps everyone aligned, even remote teams.
In action, consider a field sales rep who travels extensively; daily digests could highlight urgent leads, allowing quick responses via mobile. This feature bridges the gap between the system and real-life operations, promoting proactive management.
How to Effectively
Utilize These Tools
To truly harness the power of Odoo's analytics, it's not enough to just have the tools—you need a strategy for their optimal use. This involves thoughtful implementation to ensure they contribute meaningfully to business outcomes, avoiding common pitfalls like data overload or underutilization.
First, prioritize key indicators; focus on a handful of metrics that align with your goals rather than tracking everything. This keeps reports clean and actionable.
Set appropriate access levels so employees see only pertinent data, maintaining security and focus.
Regularly review and update KPIs as business objectives evolve, ensuring relevance.
Combine dashboards for daily oversight with digests for periodic summaries, creating a balanced monitoring system.
Incorporate training sessions to maximize adoption, and use feedback loops to refine setups. For instance, quarterly audits could reveal unused features, prompting adjustments.
By following these practices, you'll transform data from a static resource into a dynamic driver of success.
Conclusion
Odoo 18 simplifies sales reporting, making it intuitive and visual. Standard reports enable deep data dives, dashboards offer convenient KPI overviews, and digests keep teams updated effortlessly. Together, these tools build a solid foundation for data-informed decisions and sustained business growth.