The Multi-Factor Risk Profile and Mortality Prediction initiative represents a significant advancement in survivorship analysis methodology, implementing a comprehensive framework that combines unsupervised machine learning, classical survival analysis, and exposure-based probability modeling. The work was executed within data lineage in Palantir Foundry, enabling a tightly integrated and auditable analytical workflow. This approach supports more nuanced risk stratification and mortality prediction across heterogeneous populations.
Introduction
Traditional survivorship analysis often relies on univariate risk assessment, limiting its ability to capture the complex, multidimensional nature of risk factors that influence mortality outcomes. The Multi-Factor Risk Profile and Mortality Prediction initiative addresses this limitation through a three-stage analytical pipeline that transforms individual risk profiles into actionable survival probabilities.
Methodology
The methodology is organized as a three-stage analytical pipeline that integrates unsupervised machine learning, classical survival analysis, and exposure-adjusted probability modeling to systematically convert high-dimensional risk factor representations into interpretable, time-dependent mortality estimates.
Stage 1: Risk-Based Clustering
The foundation of this approach lies in representing each individual's risk profile as an encoded sequence of non-numerical risk factor codes (such as AA, AB, BA, AD). Rather than treating these factors independently, the methodology employs K-means clustering following dimensionality reduction to identify natural groupings within the population. We employ TfidfVectorizer extraction natural language technique for converting a collection of factors into numerical data.
Stage 2: Kaplan-Meier Survival Analysis
Following cluster assignment, the methodology applies classical survival analysis techniques to track time-to-event outcomes for each group. The Kaplan-Meier estimator calculates survival probability at each time point using the standard formula:
Survival_Probability(t) = Survival_Probability(t-1) × (1 - Events(t) / At_Risk(t))
Key features include:
- Proper handling of censored observations (subjects who exit without experiencing the event)
- Dynamic risk set management as the cohort size decreases over time
- Confidence interval estimation using Greenwood's formula, providing statistical bounds (CI_Lower, CI_Upper) around survival estimates
Stage 3: Exposure-Adjusted Probability Modeling
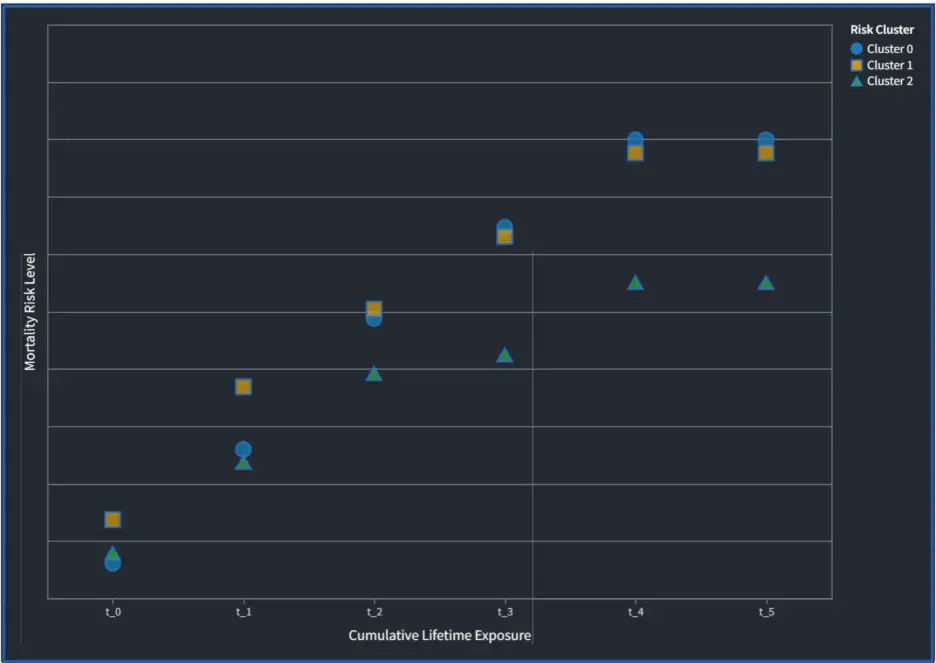
The final analytical stage introduces temporal granularity by dividing the observation period into discrete time bins ("t_0", "t_1", "t_2", "t_3", "t_4", "t_5"). This binning structure enables calculation of cumulative death probabilities conditioned on exposure duration. The analysis revealed distinct risk trajectories across the three identified clusters:
- Cluster 0, characterized by low-complexity risk profiles, paradoxically demonstrates the highest cumulative mortality risk
- Cluster 1, comprising individuals with complex, multidimensional risk profiles, exhibits the lowest mortality risk
- Cluster 2 occupies an intermediate position
- Population Risk Clusters
with Associated Hazard Rates Over Time. This table shows population risk
clusters and their associated hazard rates across variable time horizons, supporting
differentiated mortality estimates for heterogeneous populations with
multi-variate risk factors.
Across all clusters, mortality risk demonstrates a consistent pattern:
- Rapid early accumulation: The steepest increase occurs between t_0 to t_2
- Deceleration phase: Risk accumulation slows between t_3
- Plateau effect: Beyond t_4, cumulative mortality stabilizes, suggesting survivors have overcome critical risk periods
Results and Discussion
How risks combine and change over time matters more than simply how many risks a person has. By grouping individuals with similar risk patterns and tracking survival over time, clear and meaningful differences in mortality emerge.
Three risk groups were identified. Cluster 0, despite having simpler risk profiles, shows the highest mortality, suggesting that a small number of serious or unmanaged risks can be especially dangerous. Cluster 1, with more complex risk profiles, shows the lowest mortality, likely due to greater monitoring or earlier intervention. Cluster 2 falls between these two groups. Across all clusters, mortality risk increases most rapidly early on, particularly between t_0 and t_2, then slows and stabilizes (Figure 1). This indicates that early exposure is the most critical period, and those who pass it are more likely to survive longer.
Overall, these findings support cluster-based, time-sensitive risk assessment, enabling more accurate survival estimates and better-targeted interventions than traditional one-dimensional models.
These findings translate into several practical applications across healthcare, research, and actuarial contexts:
- Personalized Risk Assessment: Individual risk profiles can be mapped to specific clusters, providing tailored survival probability estimates
- Resource Allocation: Healthcare systems can prioritize interventions for high-risk clusters during critical time windows
- Clinical Trial Design: Stratification ensures balanced representation across risk profiles in research studies
- Actuarial Modeling: Insurance and benefits administration can leverage exposure-adjusted probabilities for more accurate pricing
Conclusion
The Multi-Factor Risk Profile and Mortality Prediction initiative’s multi-dimensional survivorship analysis demonstrates how modern machine learning techniques can augment traditional survival analysis methods. By combining unsupervised clustering with Kaplan-Meier estimation and exposure-based probability modeling, the framework provides a comprehensive view of mortality risk that accounts for both population heterogeneity and temporal dynamics.