Analytics maturity is a model that describes how companies, groups, or individuals progressed through various stages of data analysis over time. This model progresses from simple to more difficult types of analysis, with the working assumption that the more complex types of analytics provide more value.
In this article, we will provide an overview of the widely used analytics maturity model’s purpose and discuss how it is frequently misinterpreted. By the end of this article, you will have a more nuanced understanding of how to apply the analytics maturity model within your organization.
What is Analytics Maturity?
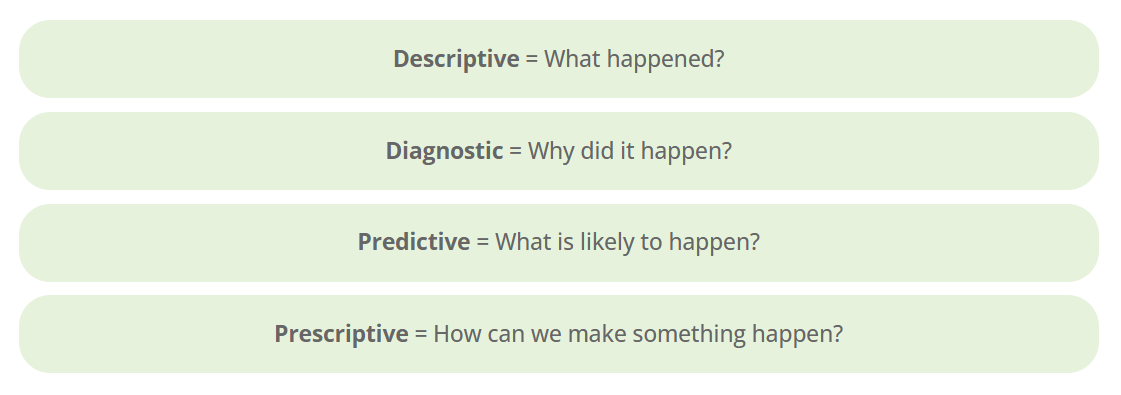
On the surface, the analytics maturity curve appears to be simply the progression of types of analysis on which an organization focuses its resources. A single descriptive analysis use case, for example, is not as valuable as a single predictive analytics use case. Knowing what happened is useful, but not as useful as predicting the future. This is how analytics maturity progresses. Each level is directly related to the types of questions we’re attempting to answer.
In an organization, answering the question “What happened yesterday?” is much easier than answering the question “What will happen tomorrow?”
This is a straightforward example of analytics maturity. In general, the more effectively an organization invests in technology, processes, and people, the more complex questions it can answer. The underlying assumption is that the answers to these more complex questions are more valuable to an organization.
The types of questions are labeled with the types of analytics:


Analyzing Analytics Maturity Models
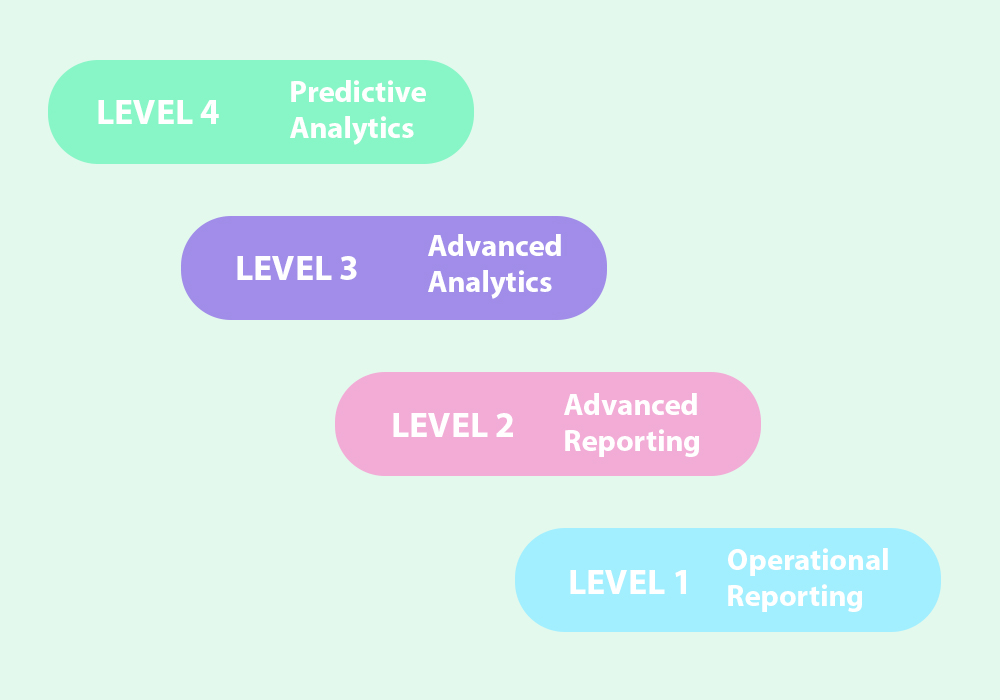
You’ve probably seen a version of the chart above if you work in data science, analytics, business intelligence, or even IT. It is so common that it has almost become cliche. Companies like Gartner have made a business out of creating cool little visuals like these, and you can find them all over the internet. It is an excellent way to differentiate between the various types of analysis. It is an excellent chart for visually demonstrating the various types of analysis.
People and businesses, however, misinterpret this visualization. They believe this is a road map. The transition from one type of analysis to another. This should not be the main point. In fact, having that as your final interpretation can be detrimental to your business.
Because of this misunderstanding, enterprises tend to overinvest in Predictive and Prescriptive analytics while underinvesting in Descriptive and Diagnostic analysis. That isn’t to say that Prescriptive analysis isn’t the “holy grail” of business intelligence; it is and will likely remain so; rather, focusing on Prescriptive analysis should not come at the expense of more foundational analysis.
Where Do People Go Wrong When It Comes to Analytics Maturity?
The main reason people misinterpret this chart is that they believe you are progressing from one type of analysis to another, from descriptive to diagnostic to predictive to prescriptive. Actually, this is not the case. You are not switching from one to the other; rather, you are expanding your organization’s analysis types.
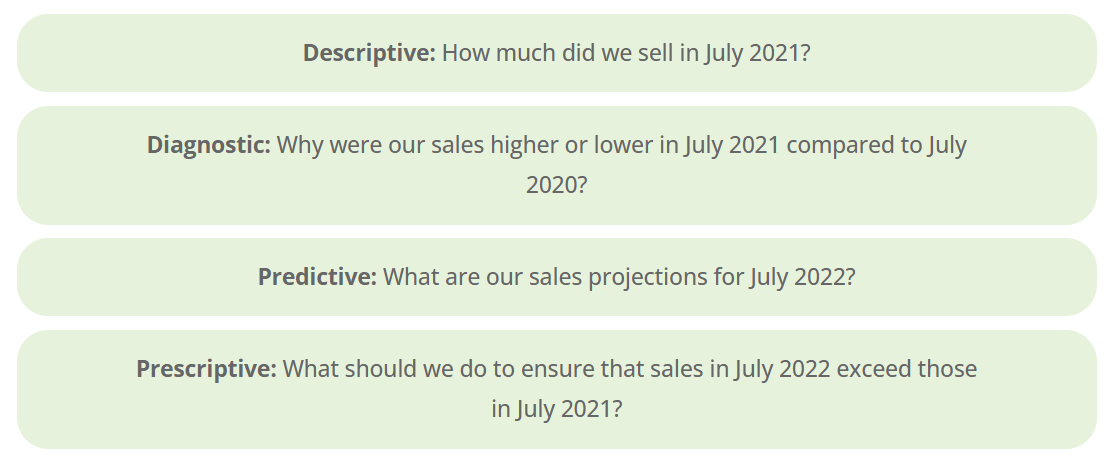
As an example, consider a basic sales use case.

You should begin with descriptive questions and work your way up from there. Undoubtedly, the prescriptive question is a much more valuable one to answer, but the descriptive question is necessary to get there.
Analysis: Some businesses overinvest in Predictive/Prescriptive analytics (and the associated resources and tools) at the expense of Descriptive/Diagnostic analytics (and the corresponding resources and tools). Avoid falling into this trap. Descriptive use cases will always exist and serve as the foundation for more valuable analyses such as diagnostic, predictive, and prescriptive analytics.
What is It if Not Progression?
How can we characterize it if it isn’t a progression? It’s all about laying the groundwork.
Diagnostic analytics is built on descriptive analytics. Predictive analytics, for example, is built on diagnostic data. A firm foundation, just like a house, is required to support all of the other elements.
Three things should be kept in mind:
- Just because a single descriptive use case is (usually) less valuable than a single prescriptive use case does not mean it isn’t beneficial overall.
- There will always be more descriptive use cases than prescriptive use cases. As you proceed along the curve, the volume at each step decreases.
- Prerequisite use cases at the other levels are also required for prescriptive use cases: predictive, diagnostic, and descriptive. Your company will never cease using these.
Ground Level of Analytics
It may be difficult to imagine, but there are still firms that do not use technology and conduct their operations with pen and paper. Even at this fundamental level, though, data is collected and controlled – at least for financial purposes.
There is no analytical strategy or organization at this point. Data is gathered to provide a better knowledge of reality, and in most situations, the only reports available are those that show financial performance. In many cases, no technology is used in data analysis. Reports are created in response to management’s ad hoc requests. However, most decisions are made based on intuition, experience, politics, market trends, or tradition.
The major issue here is a lack of vision and comprehension of the benefits of analytics. In many circumstances, there is also a lack of desire to invest time and resources in building analytical talents, owing to a lack of expertise. Changing management’s perspective and attitude would be an excellent place to start on the path to analytics maturity.
Descriptive Analytics
Most firms now employ software to collect historical and statistical data and display it in a more intelligible way; decision-makers then attempt to analyze this data on their own.
Keep Creator Personas in Mind
The architecture of your firm must accommodate multiple groups, each of which may have distinct personas.
The type of analytics that an individual (i.e. persona) focuses on is determined by their function and department within an organization. Invest in tools that will help you support both of these personas.
Line-of- Business Analysts will typically concentrate on Descriptive and Diagnostic use cases. They will typically work on a greater number of use cases (i.e. questions to answer). Despite the fact that each individual answer may not be as beneficial to the organization as a whole, the entire sum of the value supplied is quite significant owing to the volume.
Citizen Data Scientists and Analytics Engineers are typically supportive of prescriptive and predictive use cases. They often have a lower volume of use cases and answer a smaller set of questions, but the value of each of these responses can be higher.
Because each of these personas has a different focus, it is critical to choose the correct tool for that persona inside your organization.
A line-of-business analyst, for example, is probably best suited to Power BI and Tableau. Whereas Alteryx or Dataiku may be better suitable for a citizen data scientist or analytics engineers.
Let’s Take a Look at a Real-life application:
Data for Forecasting in a Variety of Areas
Machine learning and big data offer a wide range of analytical possibilities. ML algorithms are now used for marketing purposes, customer churn prediction for subscription-based businesses, product development and predictive maintenance in manufacturing, fraud detection in financial institutions, occupancy and demand prediction in travel and hospitality, forecasting disease spikes in healthcare, and many other applications. They’re even utilized in professional sports to forecast who will win the championship or who will be the next season’s superstar.
Automated Decisions Streamlining Operations
Apart from the obvious and well-known applications in marketing for targeted advertising, improved loyalty programs, highly personalized recommendations, and overall marketing strategy, the advantages of prescriptive analytics are widely applied in other industries. Automated decision support assists in the financial industry with credit risk management, the oil and gas industry with identifying best drilling locations and optimizing equipment usage, warehousing with inventory level management, logistics with route planning, travel with dynamic pricing, healthcare with hospital management, and so on.
Prescriptive analytics technologies can now address global social issues such as climate change, disease prevention, and wildlife conservation.
When you think of examples of prescriptive analytics, you might think of companies like Amazon and Netflix, which have customer-facing analytics and sophisticated recommendation engines. Other examples of how advanced technologies and decision automation may help firms include Ernsting’s family managing price, an Australian brewery organizing distribution, and Globus CR optimizing marketing strategy.
Important Challenges
The biggest obstacles a firm has at this level are not related to additional development, but rather to maintaining and optimizing their analytics infrastructure. According to studies, the primary issues with big data include data privacy, a lack of knowledge and professionals, data security, and so on. As a result, organizations should prioritize increasing their skills in data science and engineering, preserving customers private data, and maintaining the protection of their intellectual property at this time.
Conclusion
Don’t fall into the frequent pitfall of focusing solely on the gleaming predictive and prescriptive use cases. They are extremely valuable and should be invested in, but not at the expense of resources that support more fundamental analysis. Keep in mind that these “lower stages” of analysis are requirements for more complex projects.